Back chapter figures
Figure Atlas.8
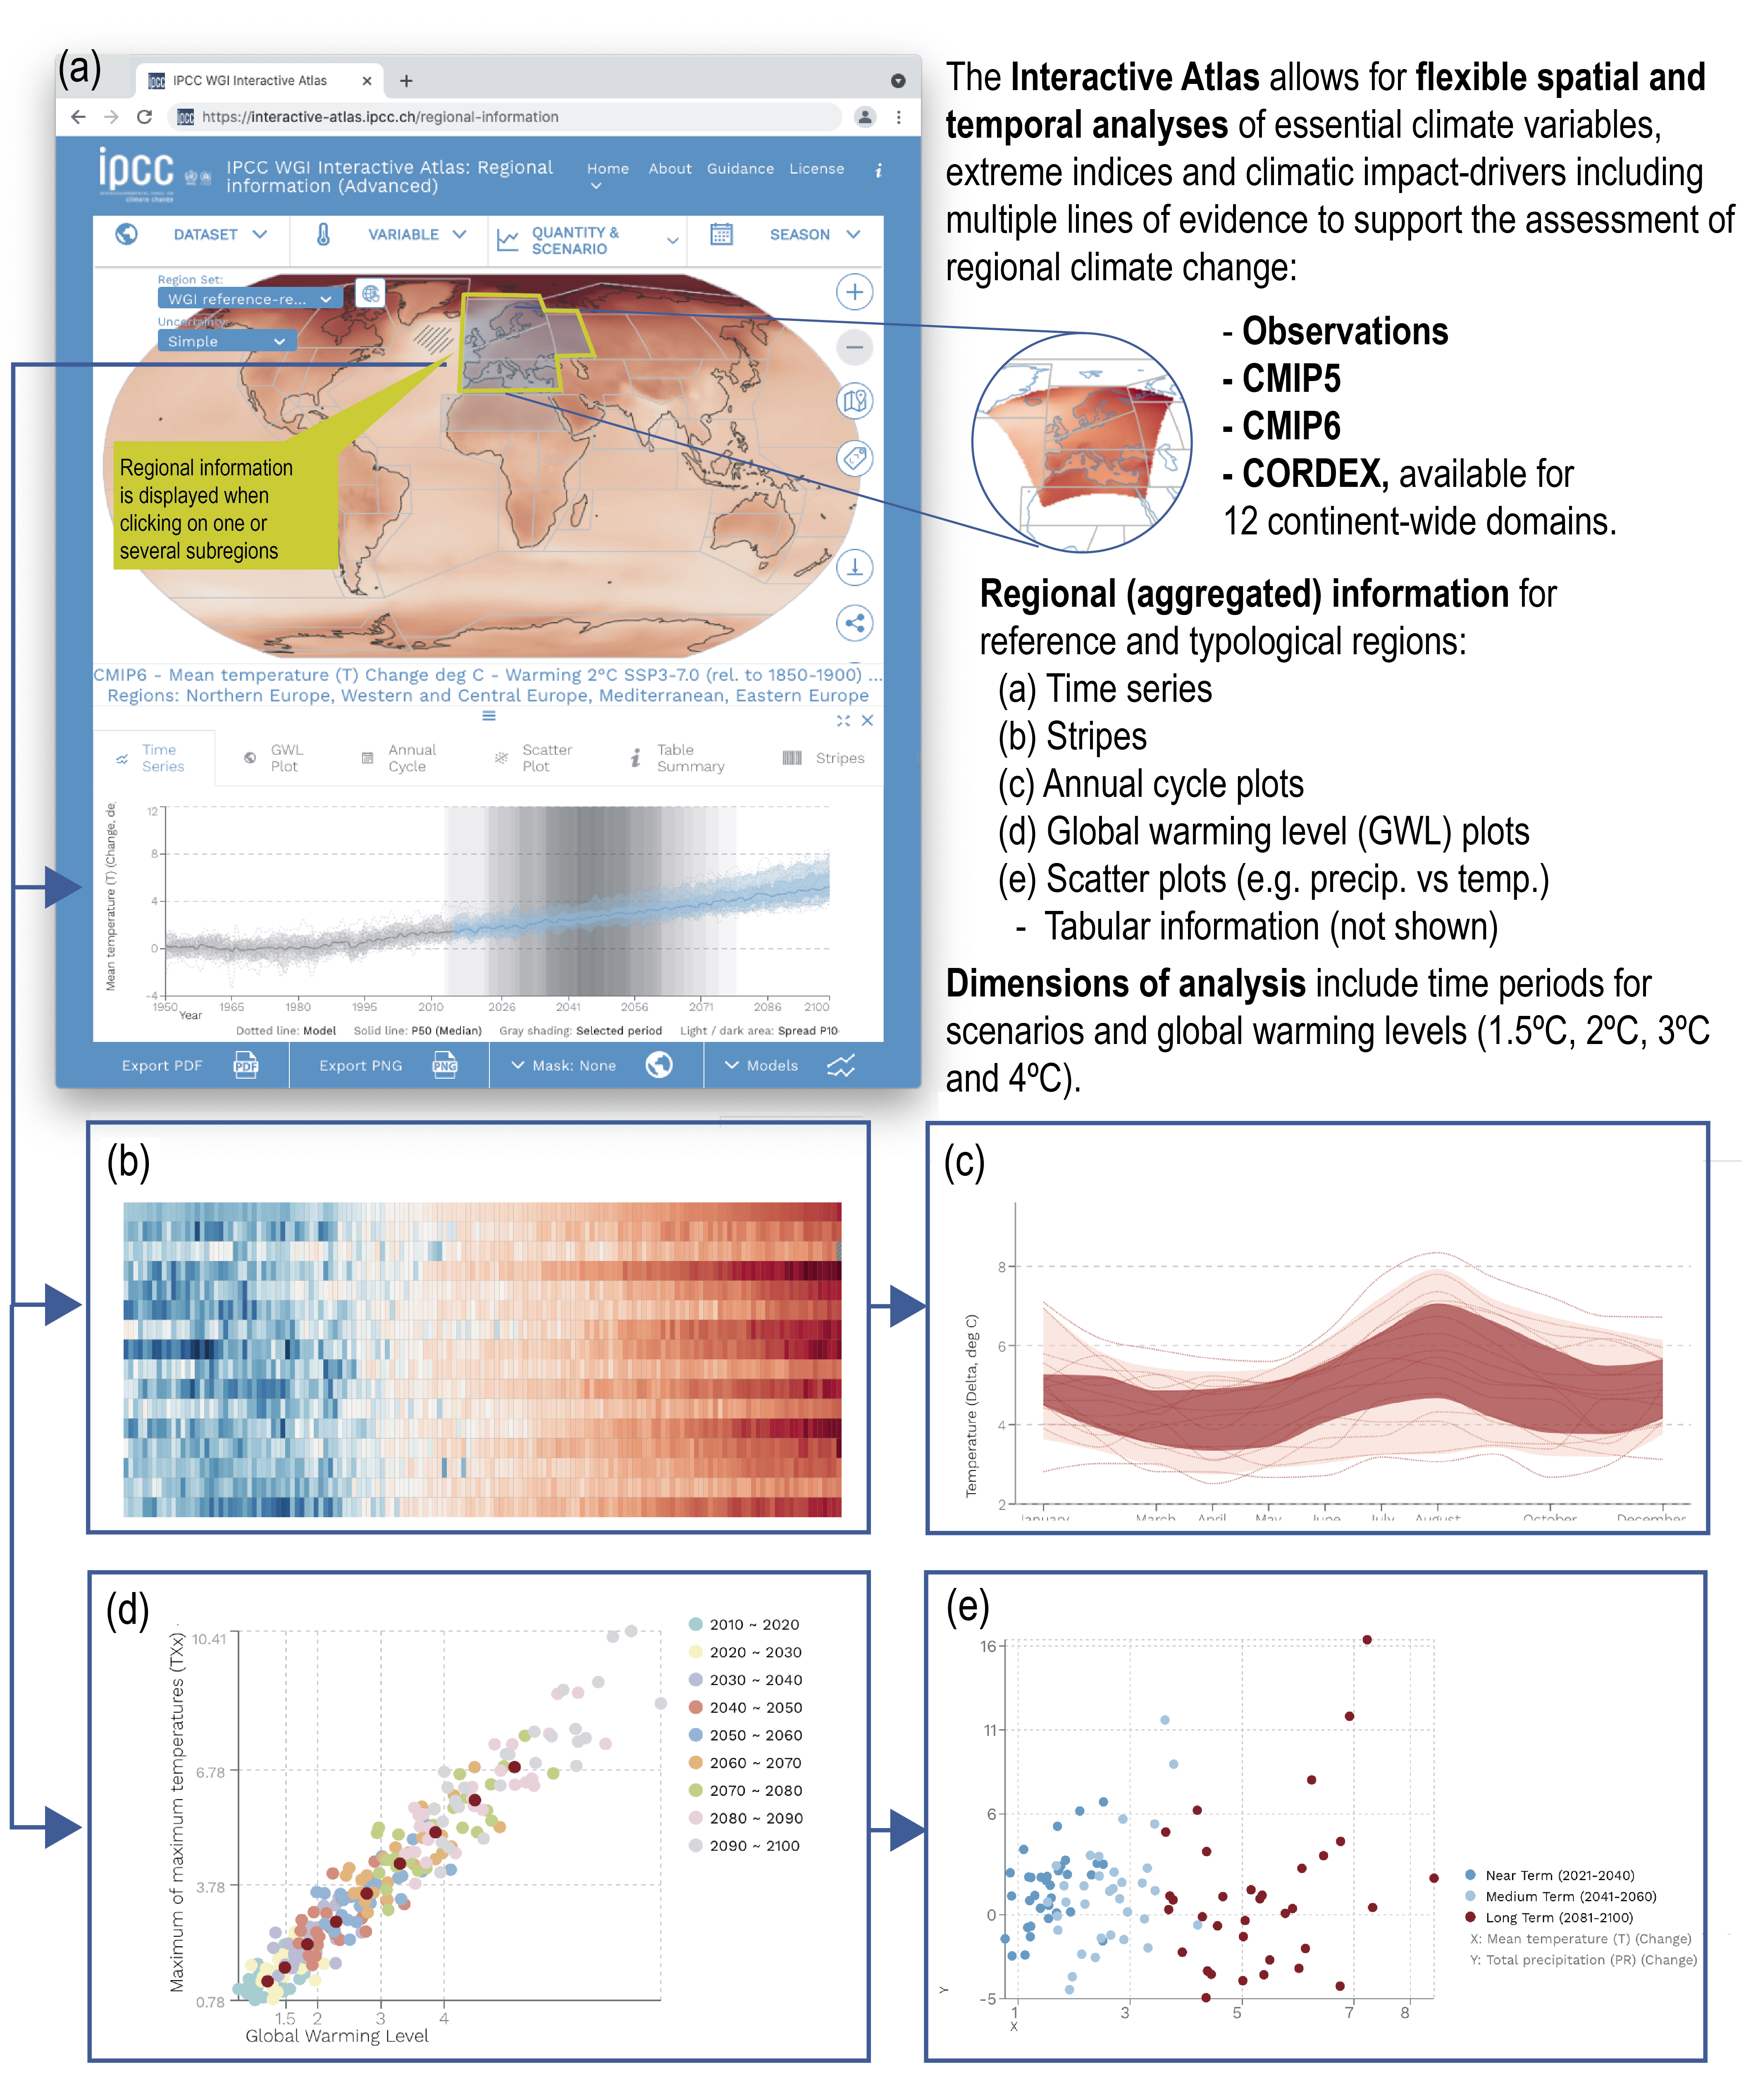
Figure caption
Figure Atlas.8| Screenshots from the Interactive Atlas (regional information). (a) The main interface includes a global map and controls to define a particular choice of dataset, variable, period (reference and baseline), and season (in this example, annual temperature change from CMIP6 for a global warming level of 2°C under SSP3-7.0 relative to 1850–1900). (b–e) Various visuals for the regionally averaged information for the selected reference regions.