Back chapter figures
Cross-Chapter Box 1.2, Figure 1
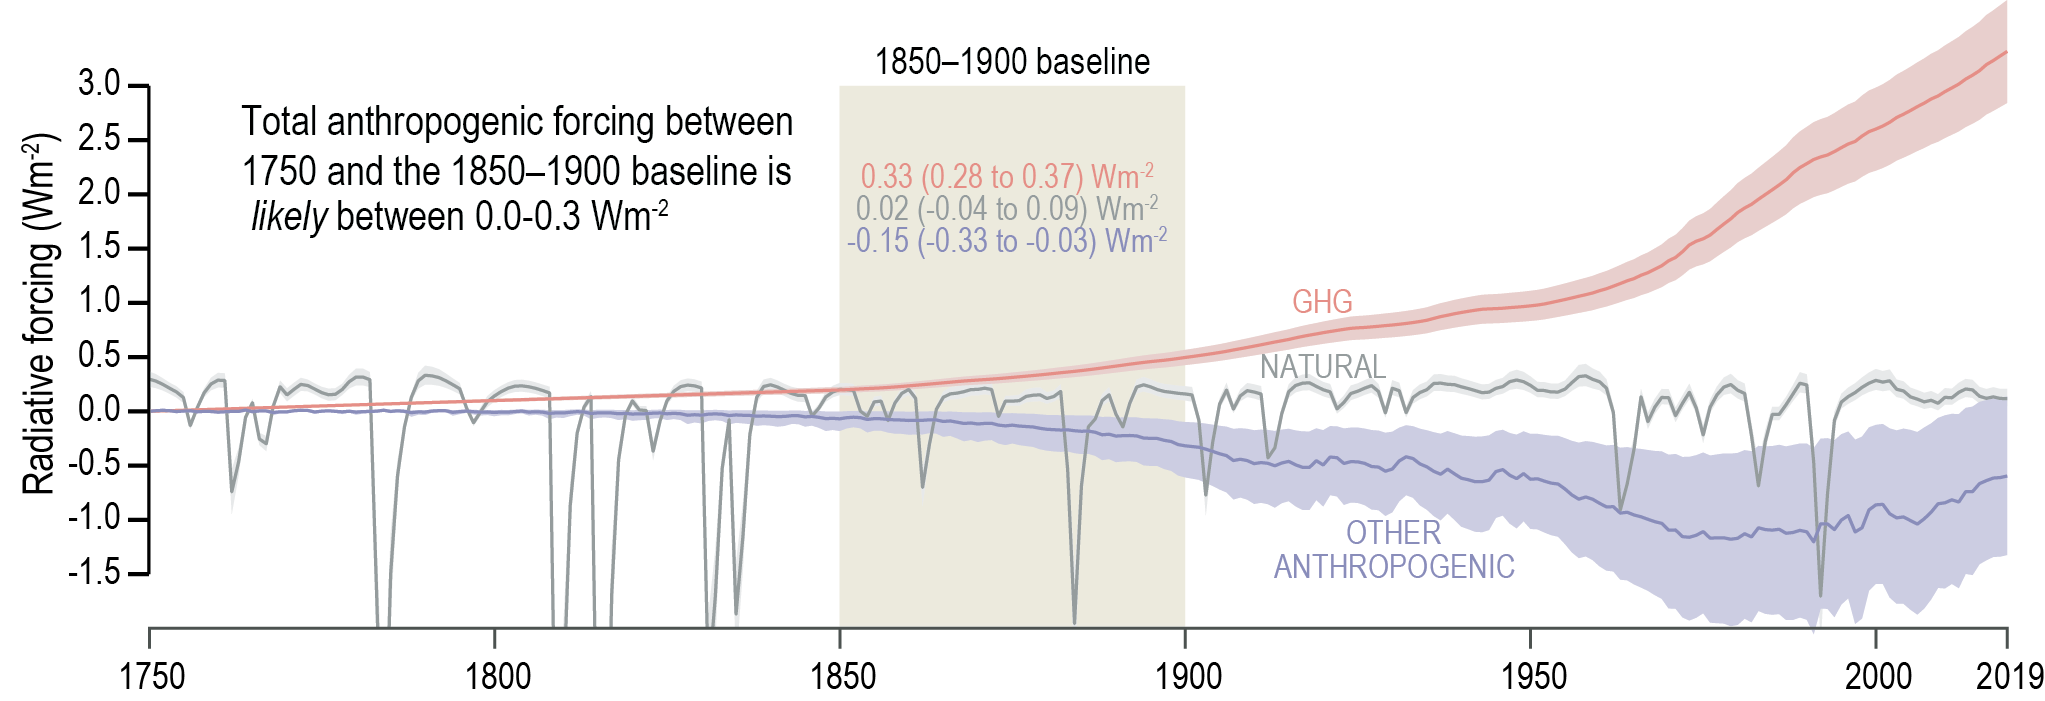
Figure caption
Cross-Chapter Box 1.2, Figure 1 | Changes in radiative forcing from 1750–2019. The radiative forcing estimates from the AR6 emulator (Cross-Chapter Box 7.1) are split into GHG, other anthropogenic (mainly aerosols and land use) and natural forcings, with the average over the 1850–1900 baseline shown for each. Further details on data sources and processing are available in the chapter data table (Table 1.SM.1).