Back chapter figures
FAQ 1.3, Figure 1
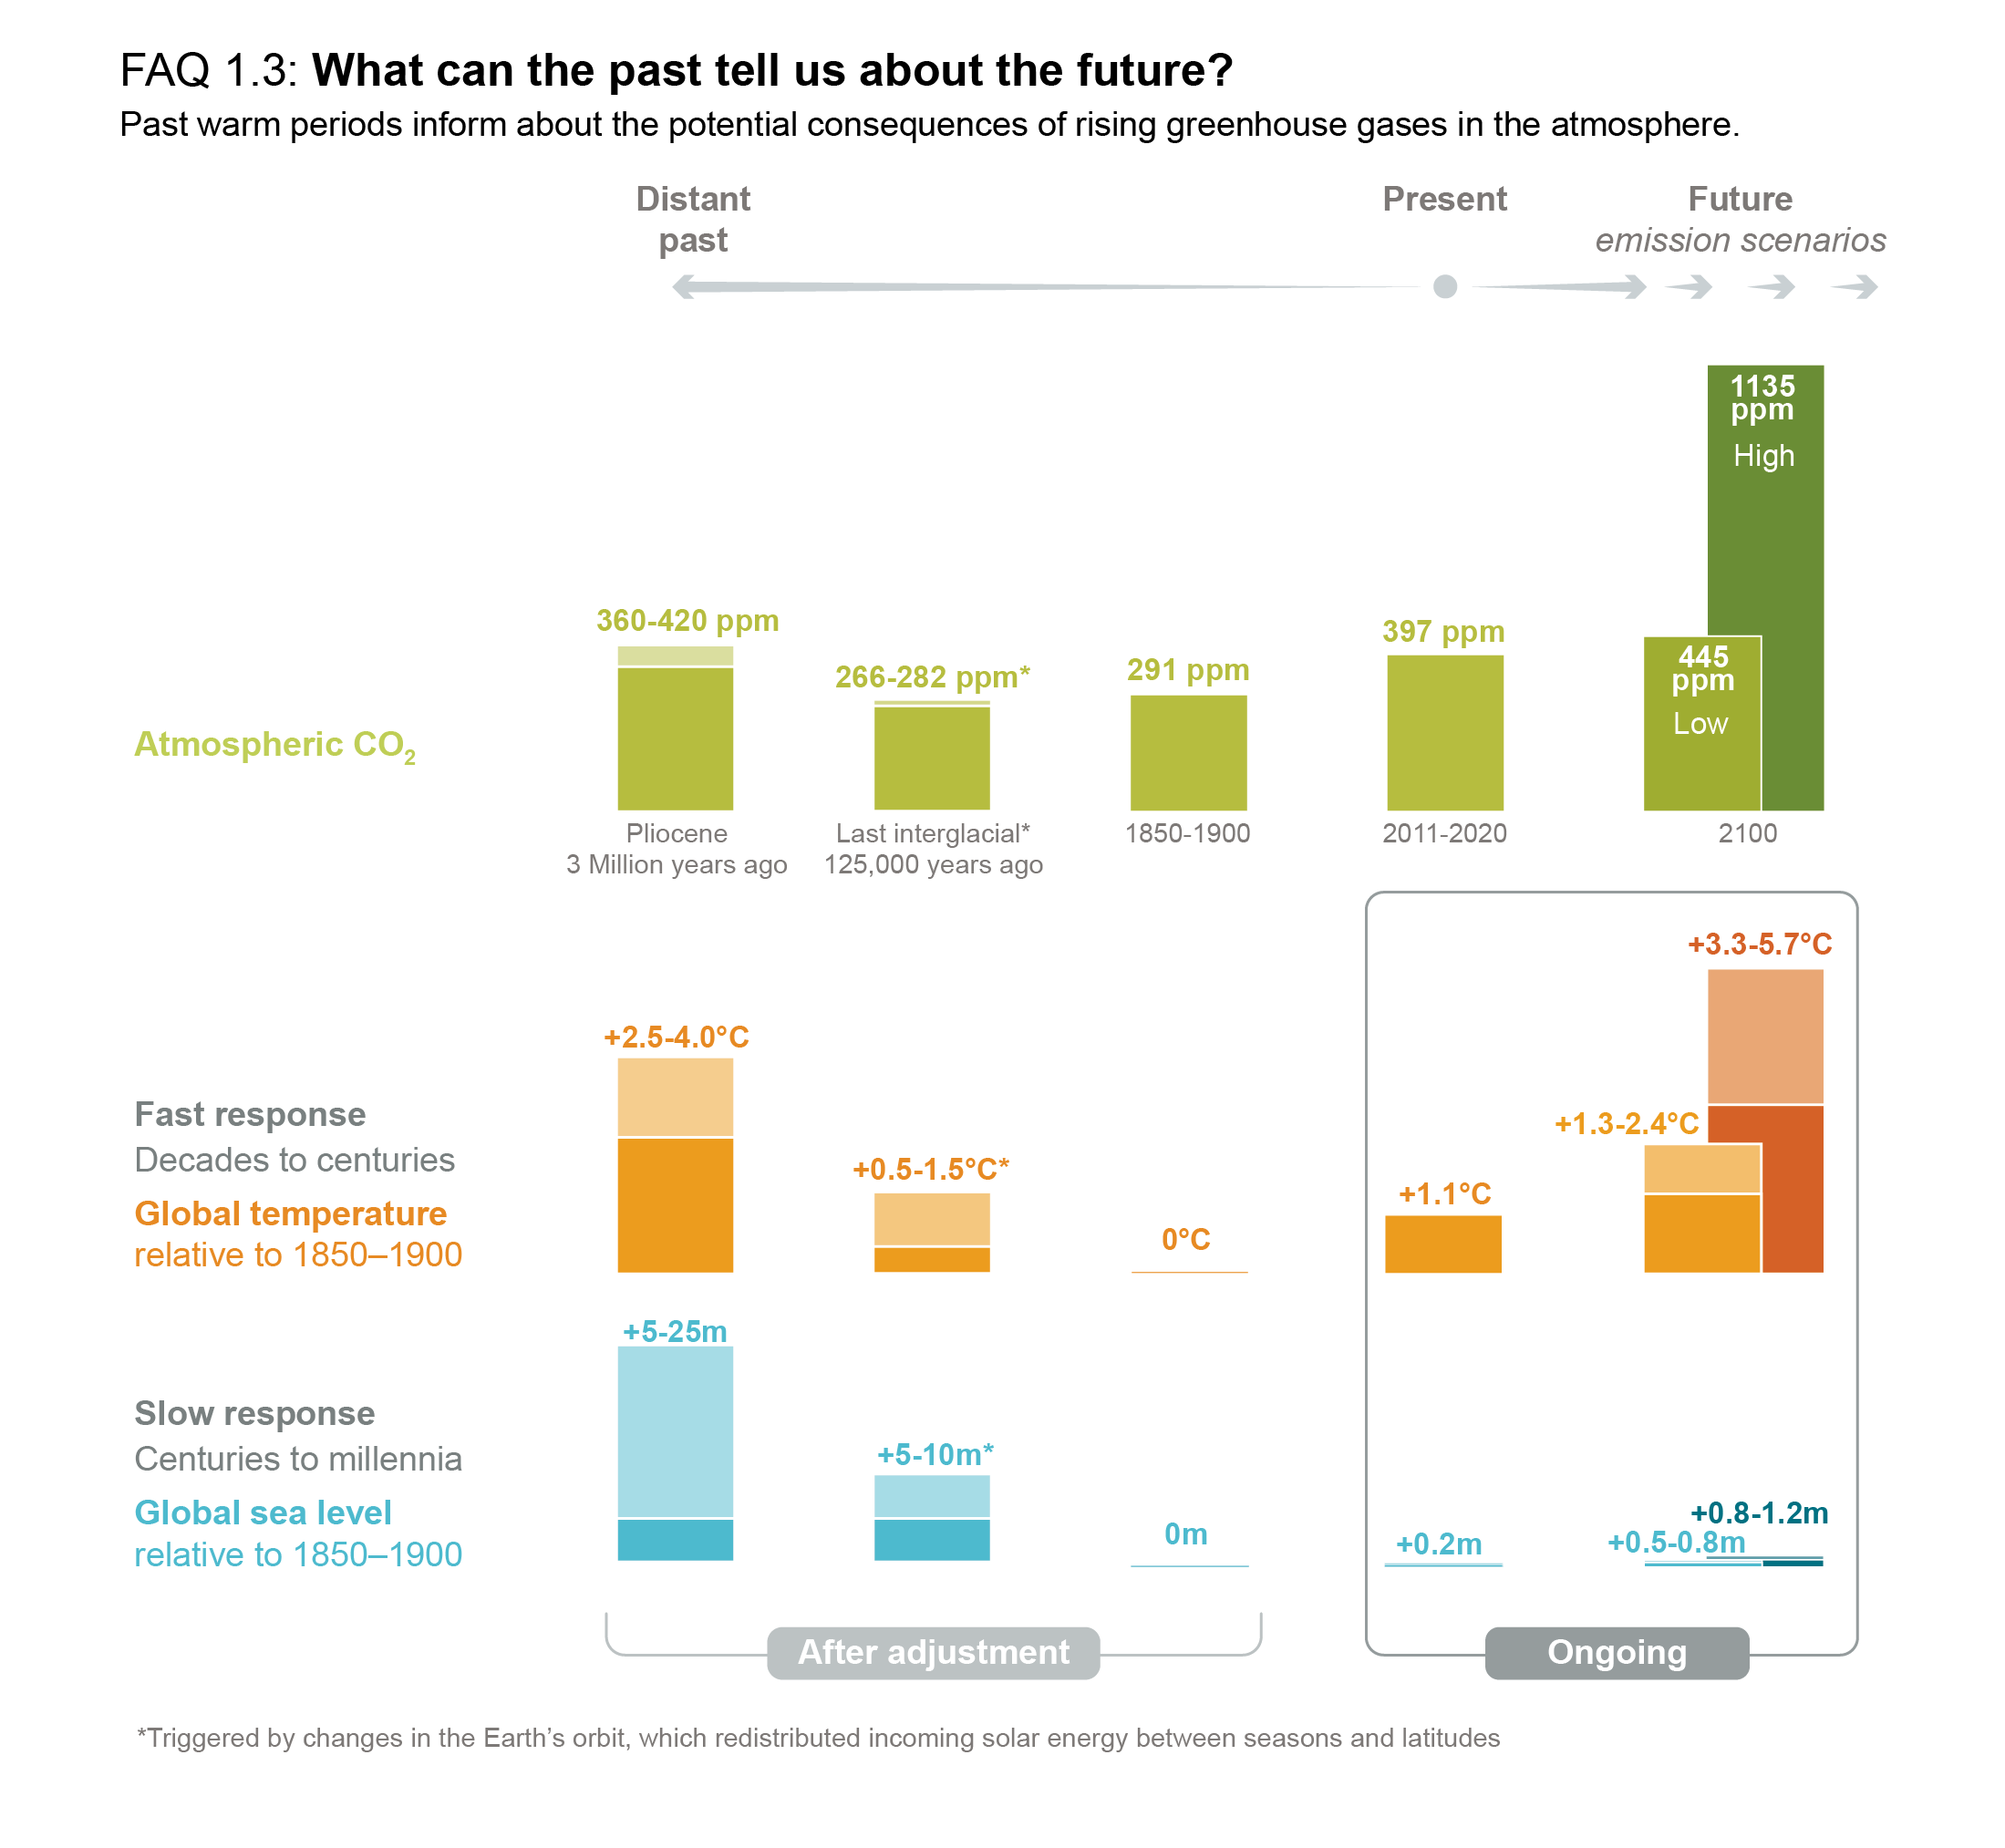
Figure caption
FAQ 1.3, Figure 1 | Comparison of past, present and future. Schematic of atmospheric carbon dioxide concentrations, global temperature, and global sea level during previous warm periods as compared to 1850–1900, present-day (2011–2020), and future (2100) climate change scenarios corresponding to low-emissions scenarios (SSP1-2.6; lighter colour bars) and very high-emissions scenarios (SSP5-8.5; darker colour bars).