Back chapter figures
Figure 1.15
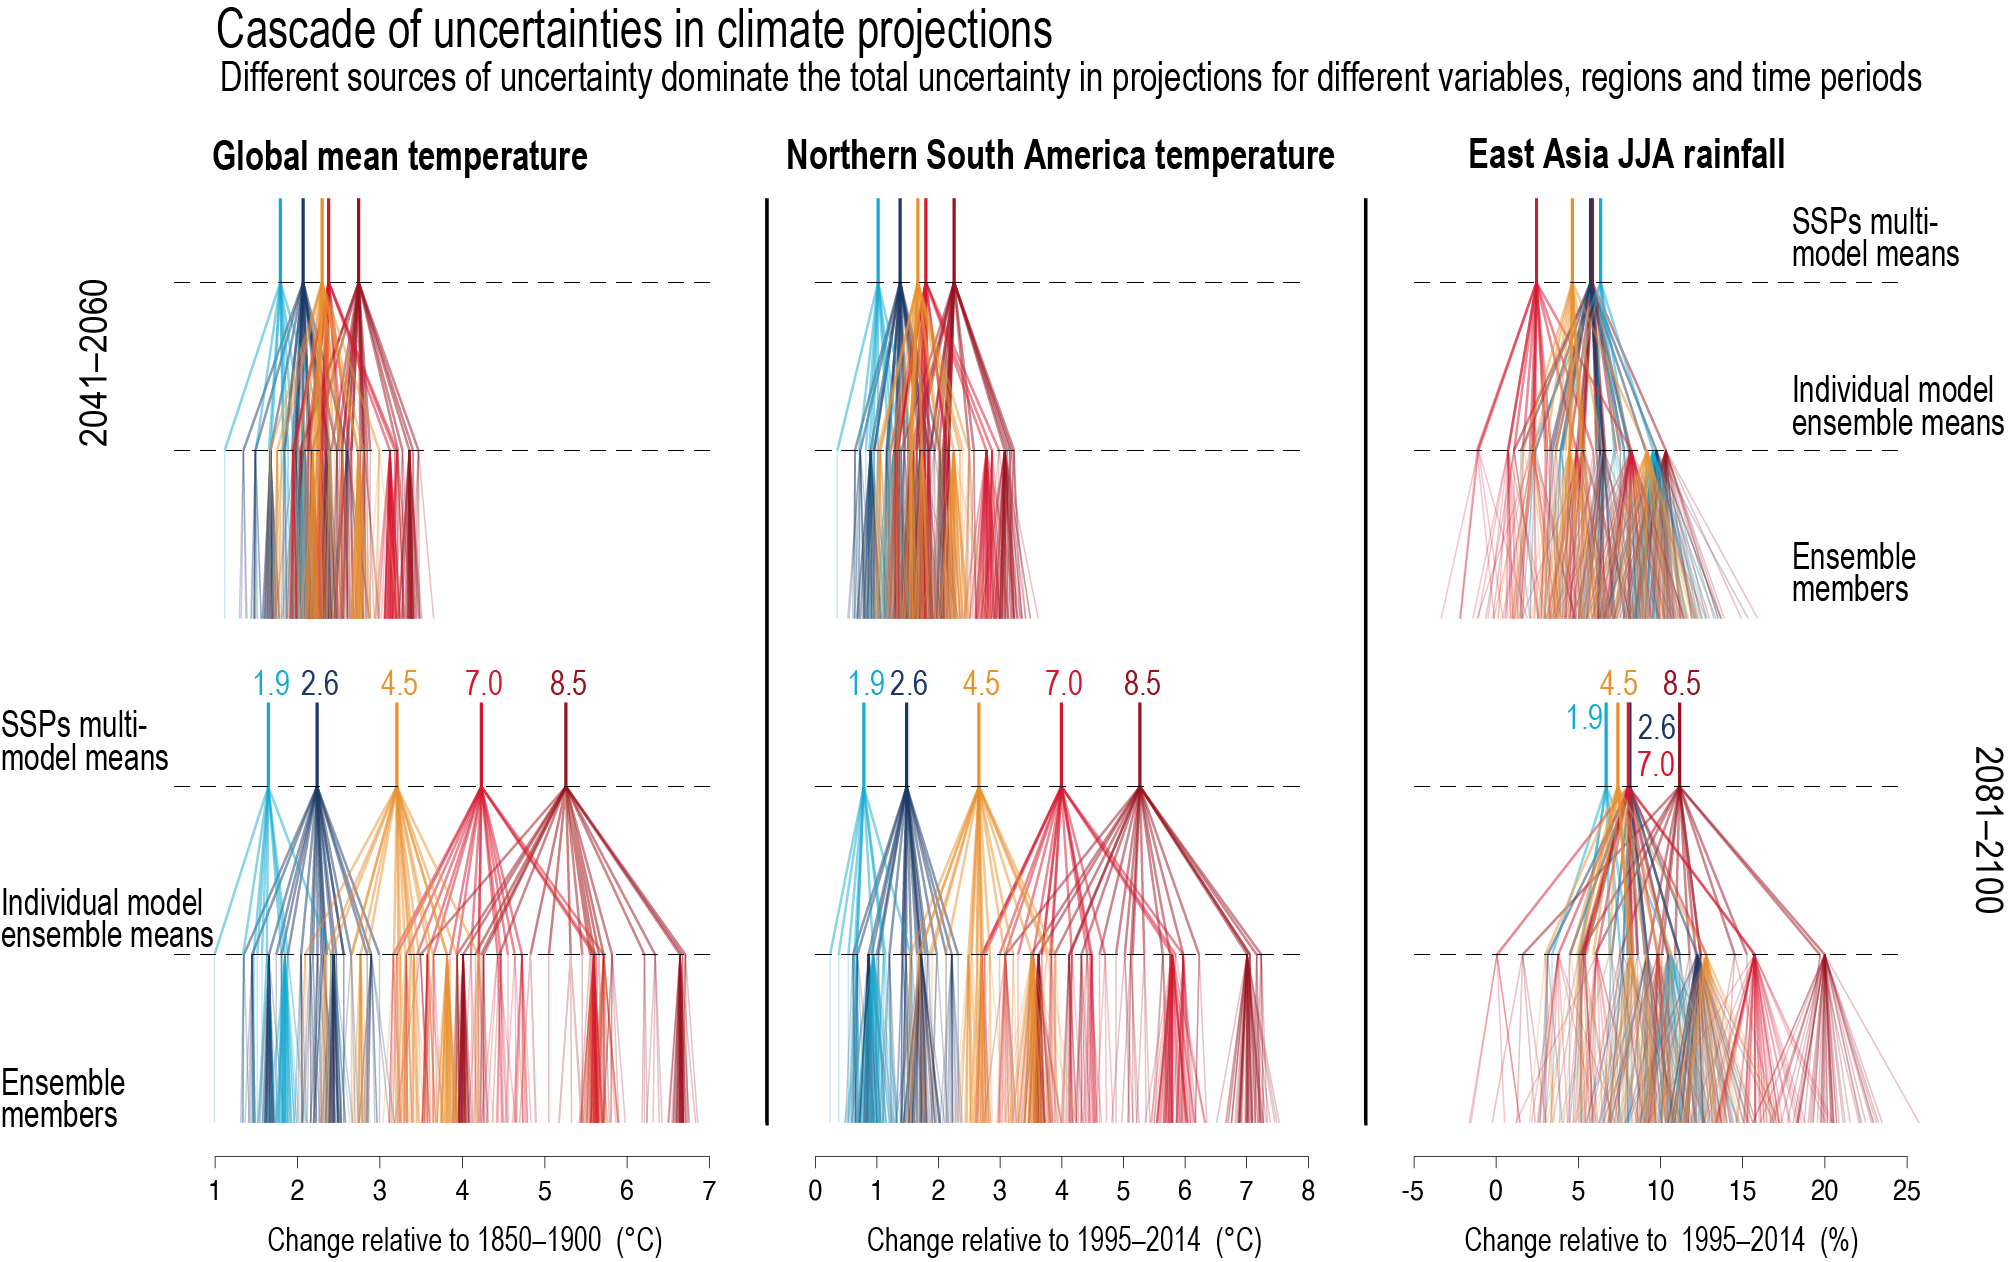
Figure caption
Figure 1.15 | The ‘cascade of uncertainties’ in CMIP6 projections. Changes in: GSAT (left); Northern South America temperature (middle); and East Asia summer (June–July–August, JJA) precipitation (right). These are shown for two time periods: 2041–2060 (top) and 2081–2100 (bottom). The SSP–radiative forcing combination is indicated at the top of each cascade at the value of the multi-model mean for each scenario. This branches downwards to show the ensemble mean for each model, and further branches into the individual ensemble members, although often only a single member is available. These diagrams highlight the relative importance of different sources of uncertainty in climate projections, which varies for different time periods, regions and climate variables. See Section 1.4.5 for the definition of the regions used. Further details on data sources and processing are available in the chapter data table (Table 1.SM.1).