Back chapter figures
Figure 10.16
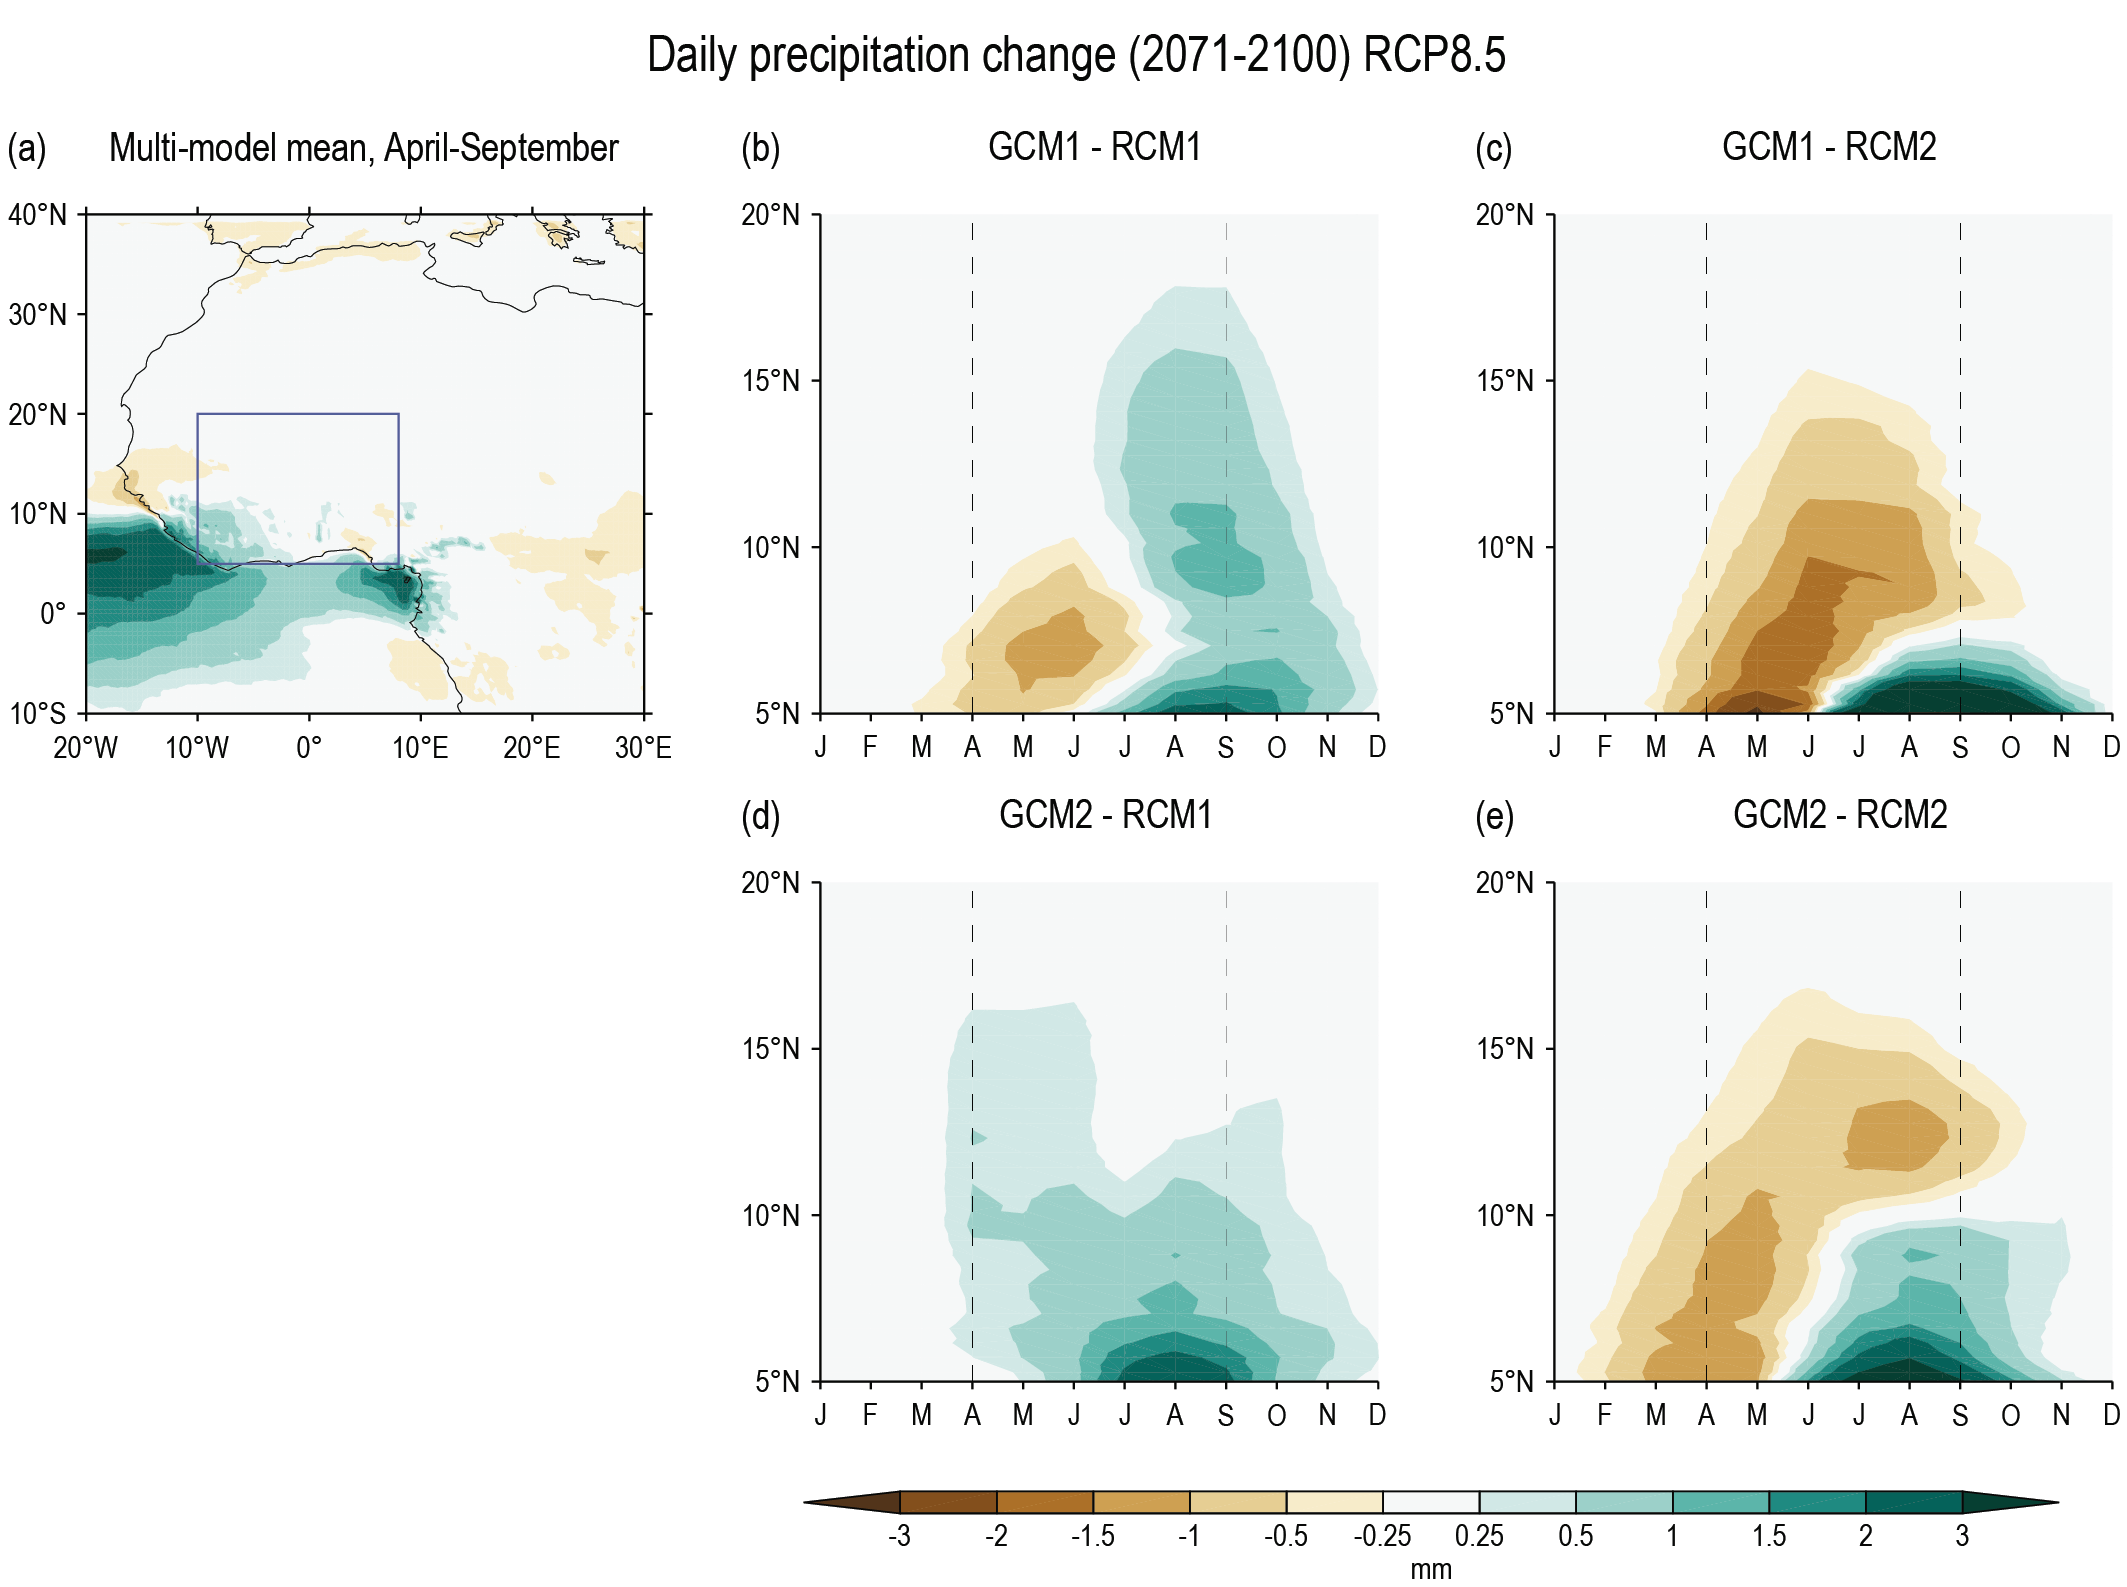
Figure caption
Figure 10.16 | Illustration of how using different sources can result in different and potentially conflicting information. Change in daily precipitation (2071–2100 RCP8.5 relative to 1981–2010) over Western Africa as simulated by an ensemble of regional climate models (RCMs) driven by global climate models (GCMs). (a) Change in daily precipitation (mm) for April to September, as mean of 17 CORDEX models (Dosio et al., 2020) (b–e) Time-latitude diagram of daily precipitation change for four selected RCM-GCM combinations. For each month and latitude, model results are zonally averaged between 10°W–10°E (blue box in a). Different GCM–RCM combinations can produce substantially different and contrasting results, when the same RCM is used to downscale different GCMs (b, d), or the same GCM is downscaled by different RCMs (d, e). GCM1=IPSL-IPSL-CM5A, GCM2=ICHEC-EC-EARTH, RCM1=RCA4, RCM2=REMO2009. Adapted from