Back chapter figures
Figure 10.7
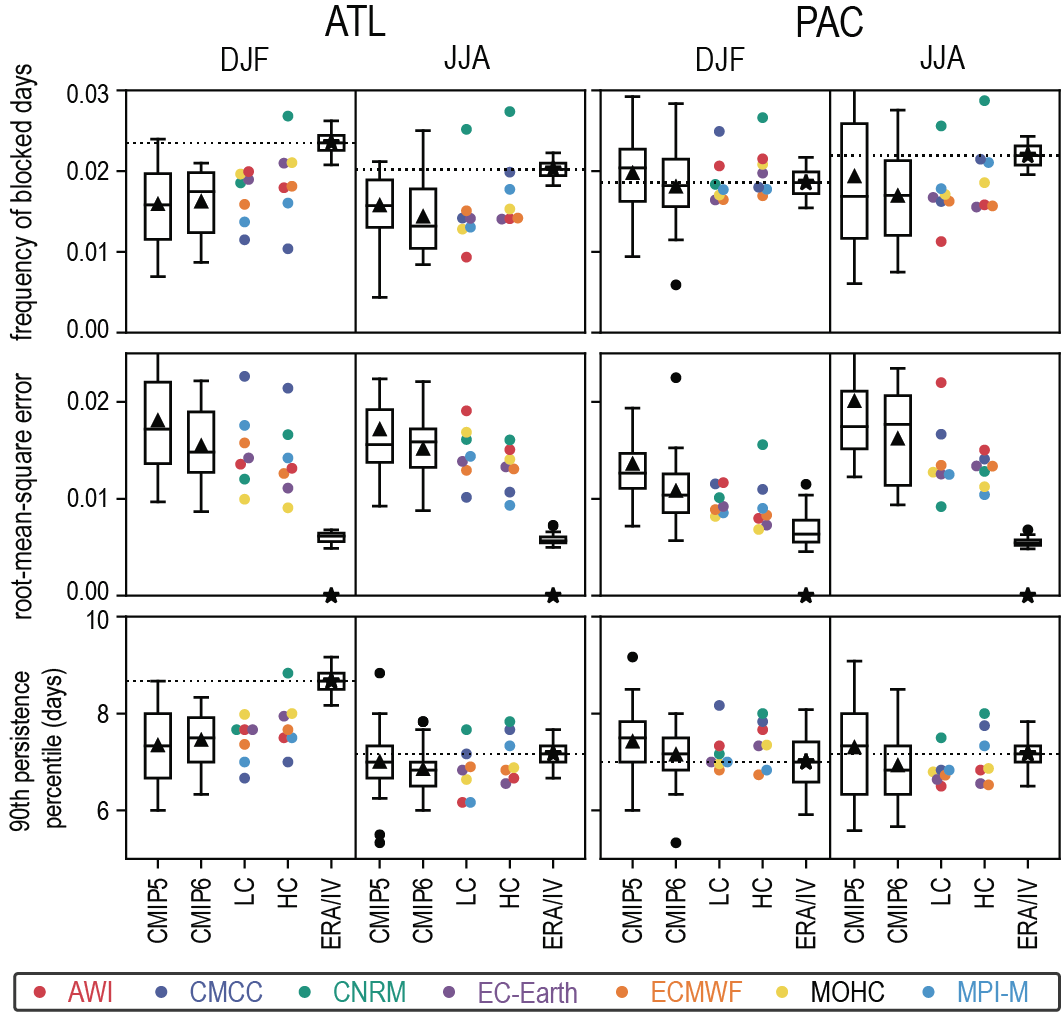
Figure caption
Figure 10.7 | Northern Hemisphere blocking performance in historical coupled simulations for different multi-model ensembles. Coupled Model Intercomparison Project Phases 5 and 6 (CMIP5/6): CMIP5 and CMIP6 Diagnostic, Evaluation and Characterization of Klima (DECK) historical simulations, 1950–2005, LC/HC: Low- (LC)/high- (HC) resolution coupled simulations from the PRIMAVERA project, 1950–2014 following the hist-1950 experiment of the CMIP6 HighResMIP Protocol (Haarsma et al., 2016). (Top) blocking frequency, for example, fraction of blocked days; (middle) root-mean-squared error in blocking frequency; (bottom) 90th percentile of blocking persistence, aggregated over an Atlantic domain (left, ATL: 90°W–90°E, 50°–75°N) and a Pacific domain (right, PAC: 90°E–270°E, 50°–75°N). Results are for boreal winter (December–January–February, DJF) and summer (June–July–August, JJA). Box-and-whisker plots for CMIP5/6 follow the methodology used in Figure 10.6 and show median (line), mean (triangle), and interquartile range (box) across 29 models for each ensemble. The reference estimate (ERA, asterisk) is from a 50-year reanalysis dataset that merged ERA-40 (1962–1978) and ERA-Interim (1979–2011) reanalyses. An estimate of internal variability for each metric (IV) is shown as a box-and-whisker plot over the asterisk and is obtained from a single-model ensemble (ECMWF-IFS high-resolution hist-1950 experiment, 6 × 65 years). For details on the methodology see (Schiemann et al., 2020). Further details on data sources and processing are available in the chapter data table (Table 10.SM.11).