Cross-Chapter Box 2.1, Figure 1
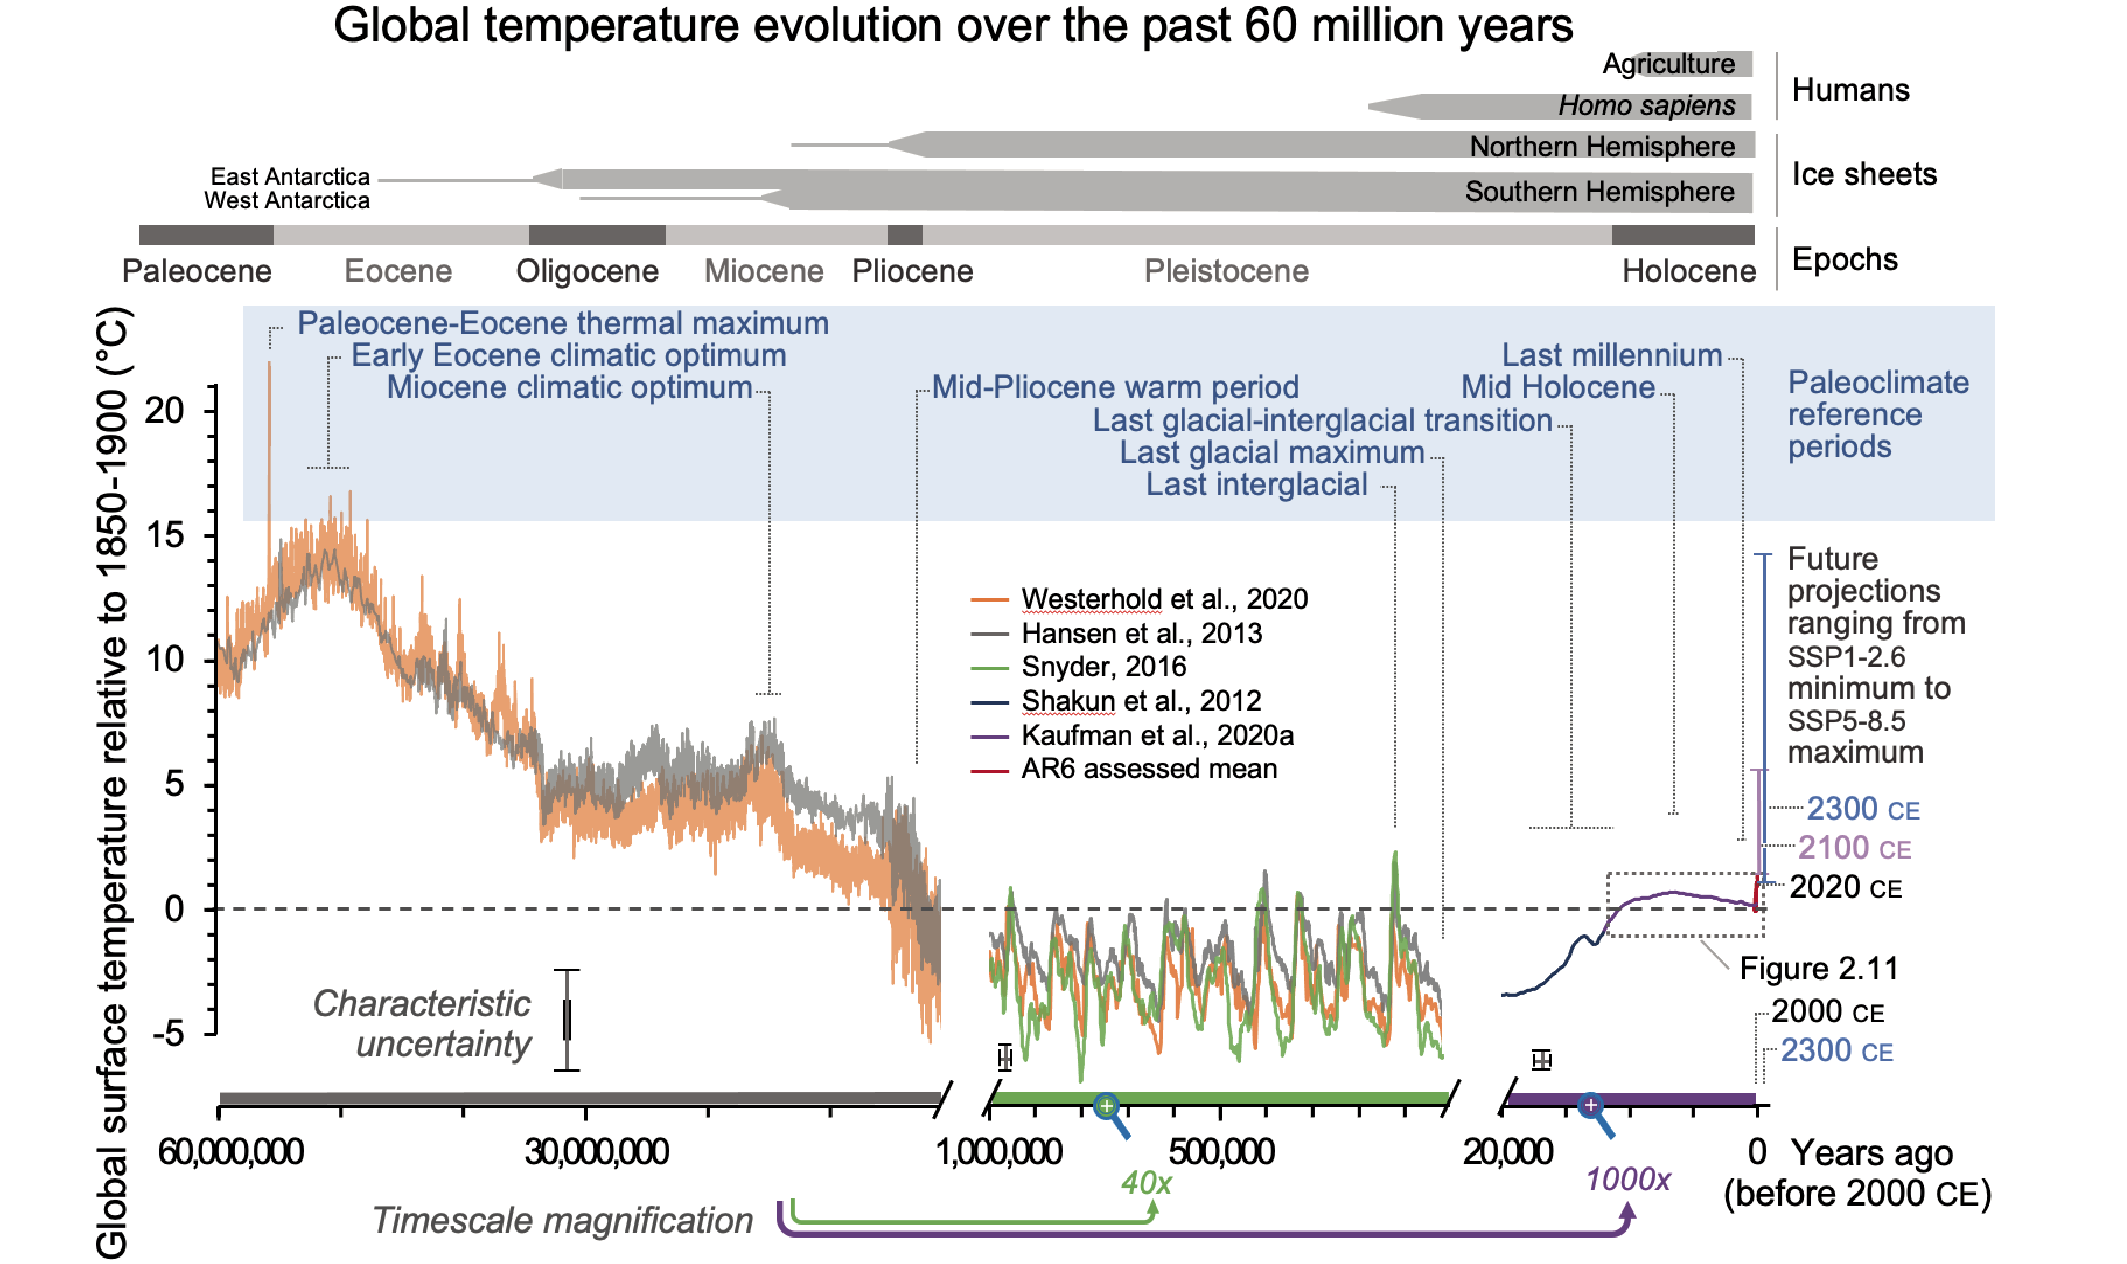
Figure caption

Cross-Chapter Box 2.1, Figure 1 | Global mean surface temperature (GMST) over the past 60 million years (60 Myr) relative to 1850–1900 shown on three time scales. Information about each of the nine paleo reference periods (blue font) and sections in AR6 that discuss these periods are listed in Cross-Chapter Box 2.1 Table 1. Grey horizontal bars at the top mark important events. Characteristic uncertainties are based on expert judgement and are representative of the approximate midpoint of their respective time scales; uncertainties decrease forward in time. GMST estimates for most paleo reference periods (Figure 2.34) overlap with this reconstruction, but take into account multiple lines of evidence. Future projections span the range of global surface air temperature best estimates for SSP1–2.6 and SSP5–8.5 scenarios described in Section 1.6. Range shown for 2100 is based on CMIP6 multi-model mean for 2081–2100 from Table 4.5; range for 2300 is based upon an emulator and taken from Table 4.9. Further details on data sources and processing are available in the chapter data table (Table 2.SM.1).