Back chapter figures
Figure 2.29
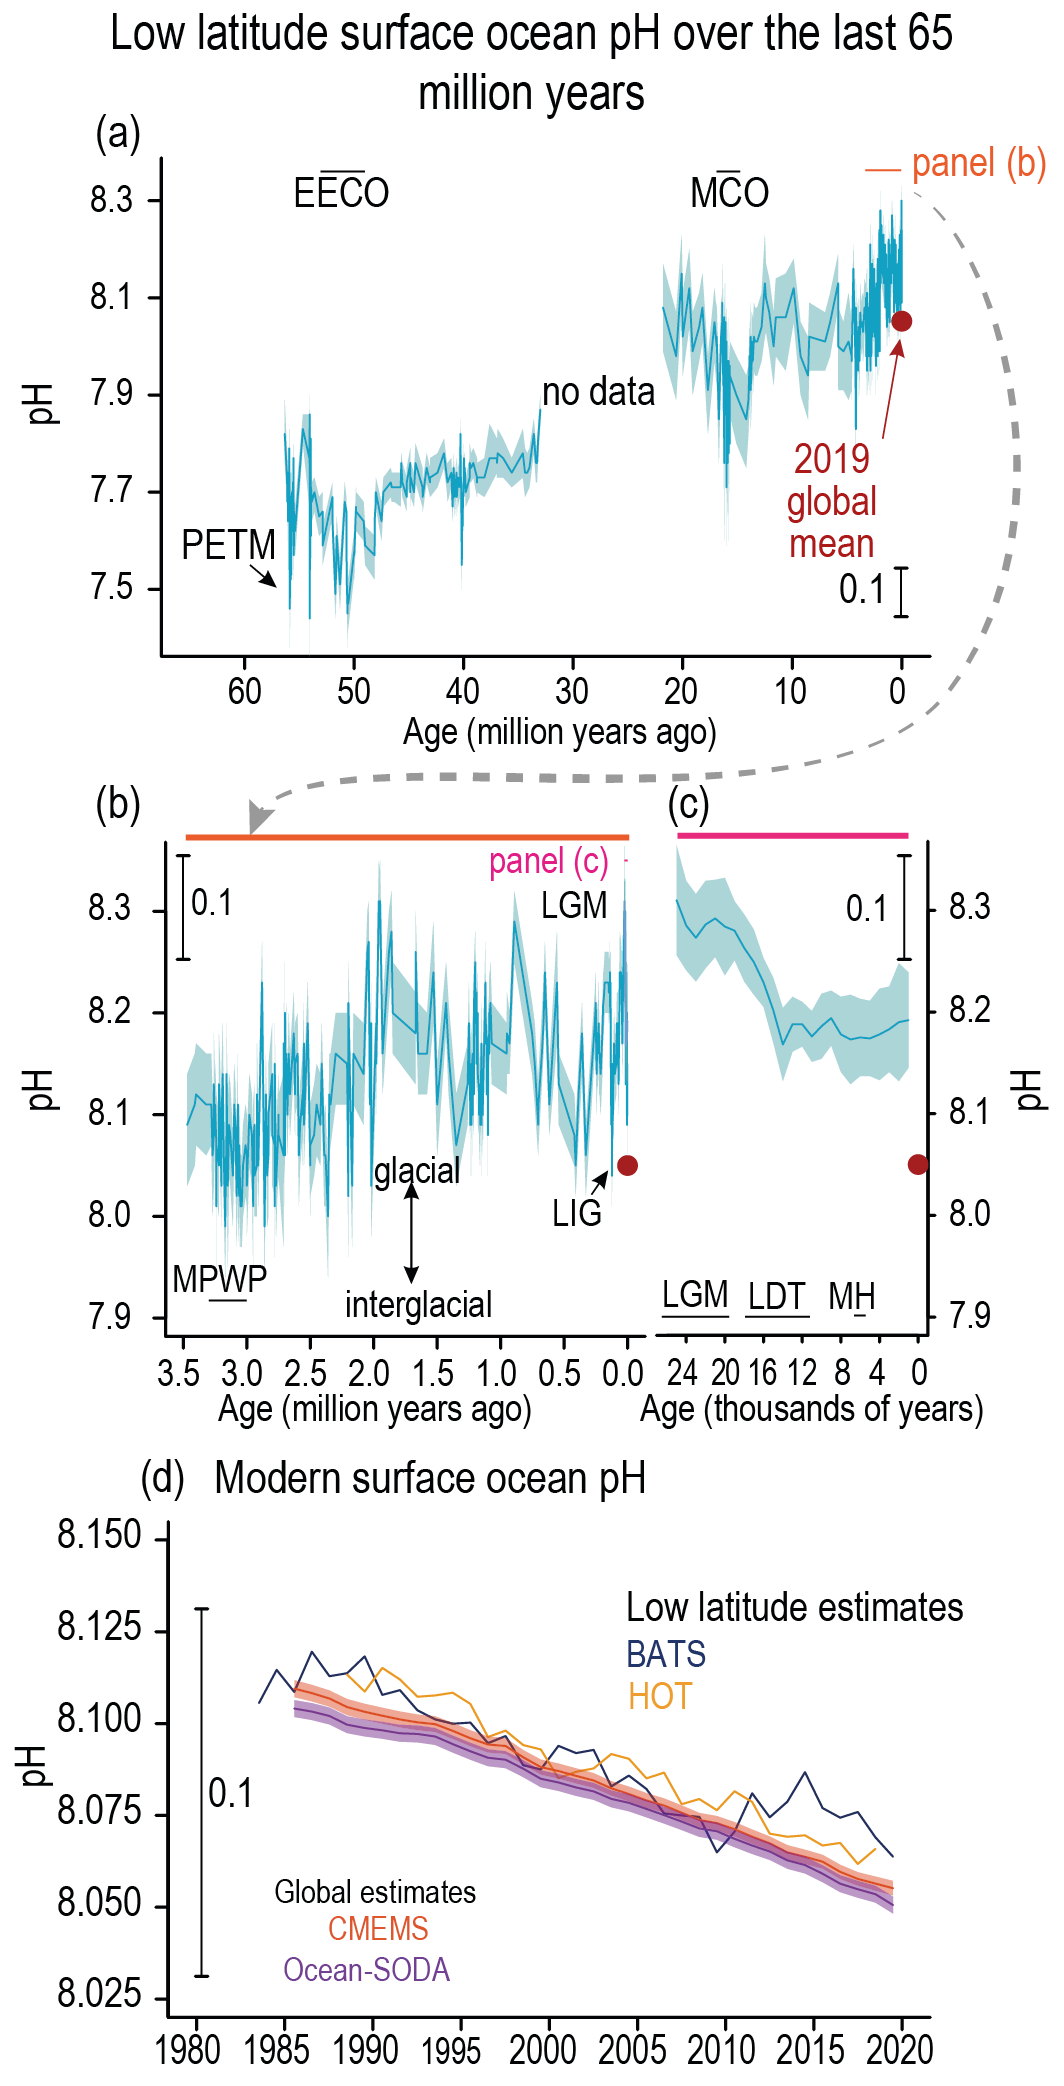
Figure caption
Figure 2.29 | Low-latitude surface ocean pH over the last 65 million years (65 Myr). (a) Low-latitude (30°N–30°S) surface ocean pH over the last 65 Myr, reconstructed using boron isotopes in foraminifera. (b) as (a) but for the last 3.5 Myr. Double headed arrow shows the approximate magnitude of glacial-interglacial pH changes. (c) Multisite composite of surface pH. In (a, b, c) uncertainty is shown at 95% confidence as a shaded band. Relevant paleoclimate reference periods (CCB2.1) have been labelled. Period windows for succeeding panels are shown as horizontal black lines in (a) and (b). (d) Estimated low-latitude surface pH from direct observations (BATS, HOT) and global mean pH (65°S–65°N) from two indirect estimates (CMEMS, OCEAN-SODA). Further details on data sources and processing are available in the chapter data table (Table 2.SM.1).