Back chapter figures
Figure 2.5
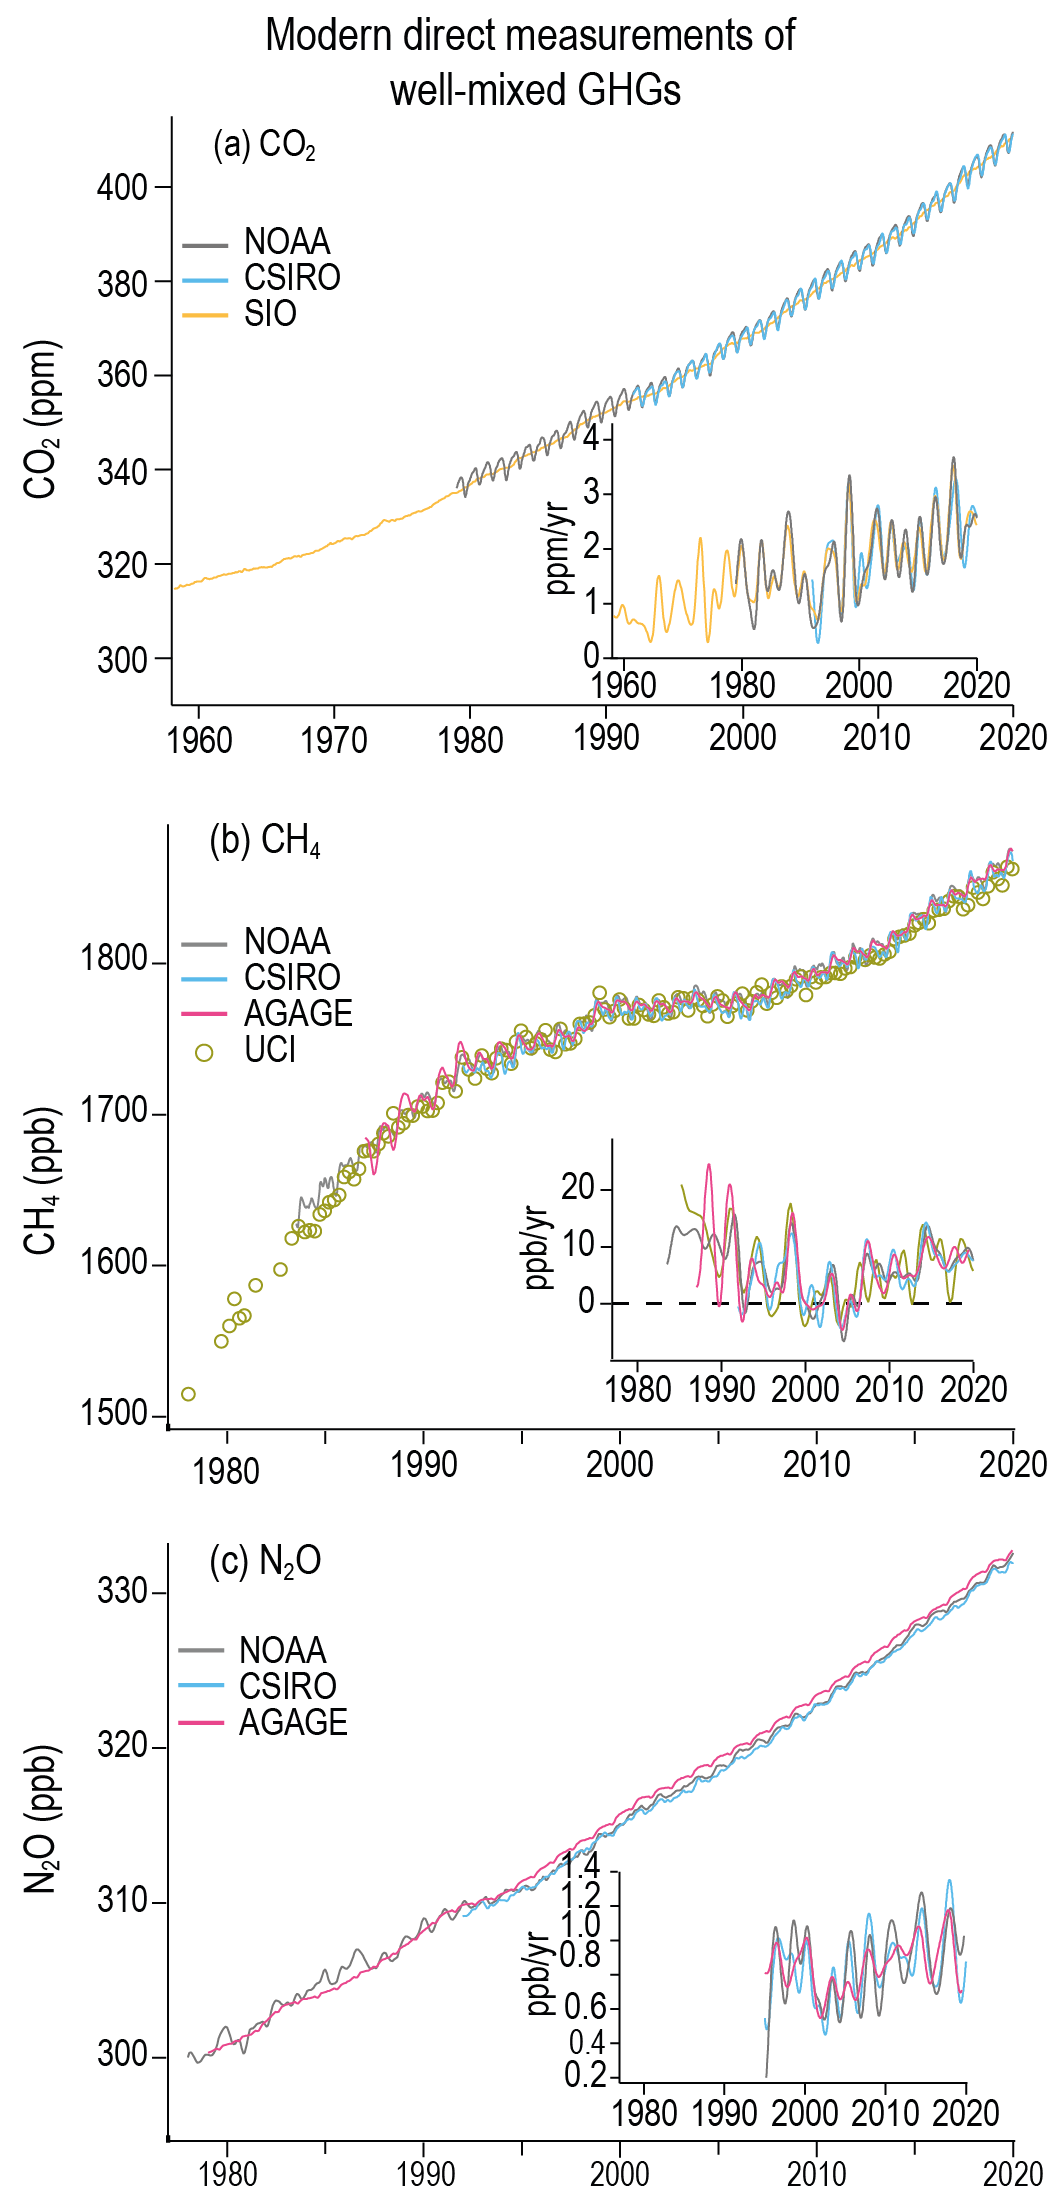
Figure caption
Figure 2.5 | Globally averaged dry-air mole fractions of greenhouse gases. (a) CO2 from SIO, CSIRO, and NOAA/GML (b) CH4 from NOAA, AGAGE, CSIRO, and UCI; and (c) N2O from NOAA, AGAGE, and CSIRO (Table 2.2). Growth rates, calculated as the time derivative of the global means after removing seasonal cycle are shown as inset figures. Note that the CO2 series is 1958–2019 whereas CH4, and N2O are 1979–2019. Units are parts per million (ppm) or parts per billion (ppb). Further details on data are in Annex III, and on data sources and processing are available in the chapter data table (Table 2.SM.1).