Back chapter figures
Figure 3.17
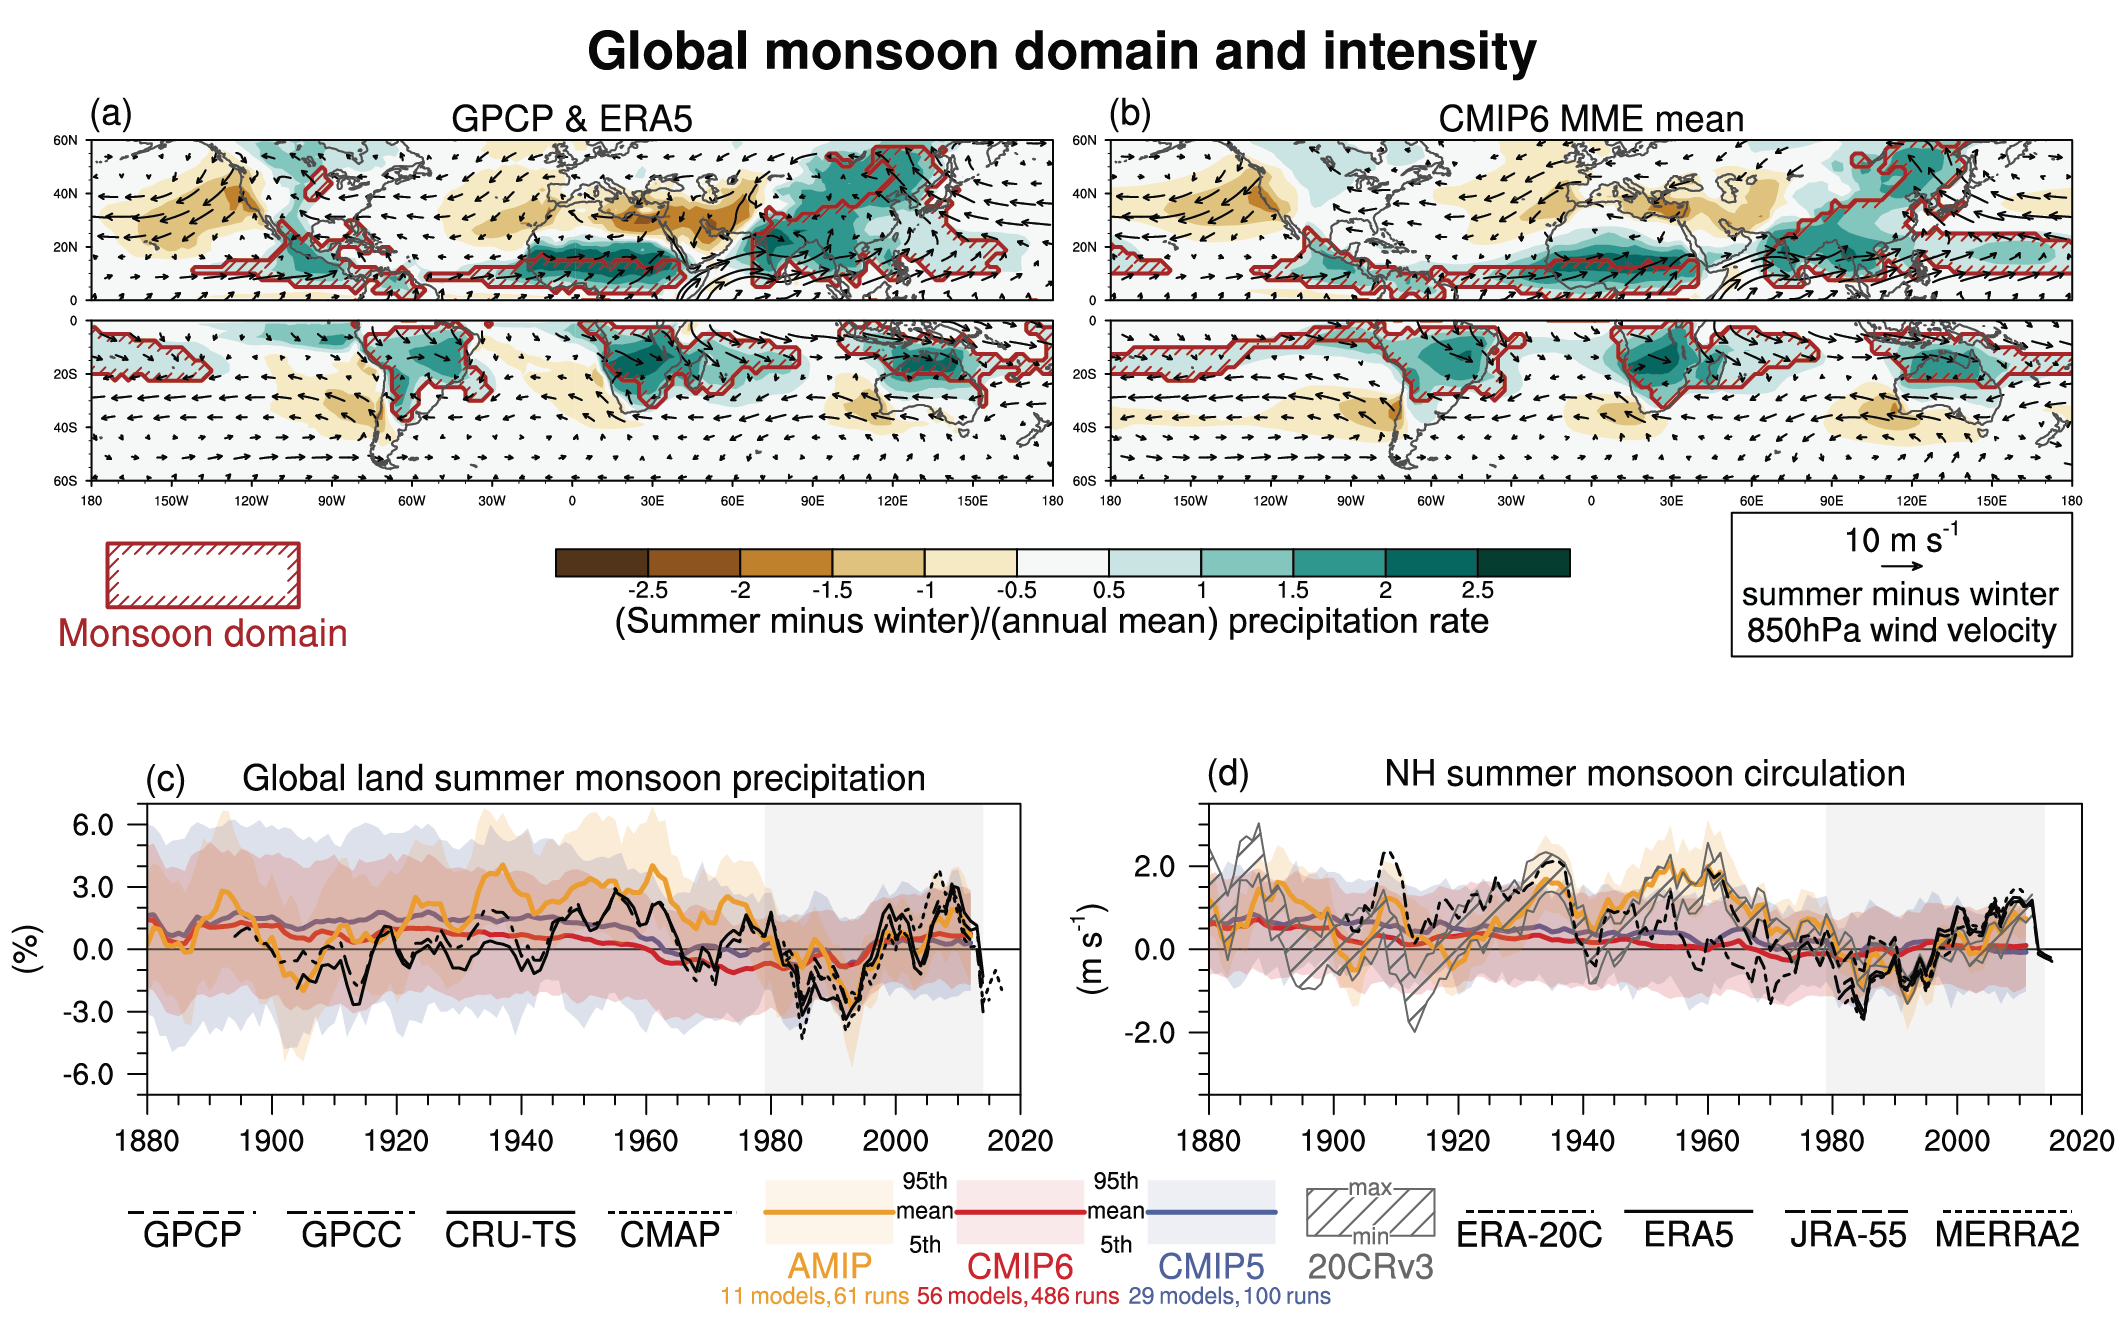
Figure caption
Figure 3.17 | Model evaluation of global monsoon domain, intensity, and circulation. (a, b) Climatological summer-winter range of precipitation rate, scaled by annual mean precipitation rate (shading) and 850 hPa wind velocity (arrows) based on (a) GPCP and ERA5 and (b) a multi-model ensemble mean of CMIP6 historical simulations for 1979–2014. The region enclosed by red lines is the monsoon domain based on the definition by Wang and Ding (2008). (c, d) Five-year running mean anomalies of (c) global land monsoon precipitation index defined as the percentage anomaly of the summertime precipitation rate averaged over the monsoon regions over land, relative to its average for 1979–2014 (the period indicated by light grey shading) and (d) the tropical monsoon circulation index defined as the vertical shear of zonal winds between 850 and 200 hPa levels averaged over 0°–20°N, from 120°W eastward to 120°E in Northern Hemisphere summer (Wang et al., 2013; m s–1) in CMIP5 historical and RCP4.5 simulations, and CMIP6 historical and AMIP simulations. Summer and winter are defined for individual hemispheres: May to September is defined as Northern Hemisphere summer and Southern Hemisphere winter, and November to March is defined as Northern Hemisphere winter and Summer Hemisphere summer. The numbers of models and simulations are given in the legend. The multi-model ensemble mean and percentiles are calculated after weighting individual ensemble members with the inverse of the ensemble size of the same model, so that individual models are equally weighted irrespective of ensemble size. Further details on data sources and processing are available in the chapter data table (Table 3.SM.1).