Back chapter figures
Figure 3.18
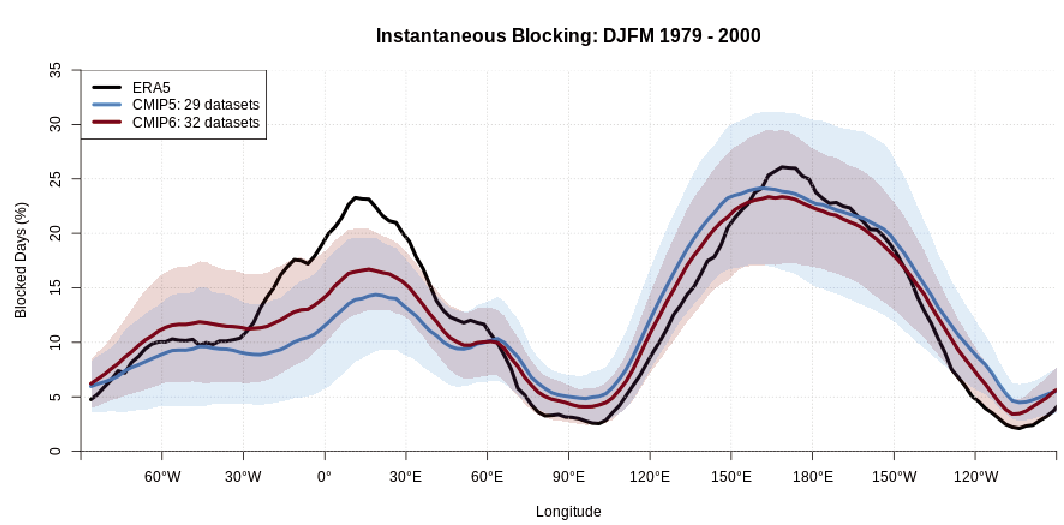
Figure caption
Figure 3.18 | Instantaneous Northern-Hemisphere blocking frequency (% of days) in the extended northern winter season (December–January–February–March – DJFM) for the years 1979–2000. Results are shown for the ERA5 reanalysis (black), CMIP5 (blue) and CMIP6 (red) models. Coloured lines show multi-model means and shaded ranges show corresponding 5–95% ranges constructed with one realization from each model. Figure is adapted from Davini and D’Andrea (2020), their Figure 12 and following the D’Andrea et al. (1998) definition of blocking. Further details on data sources and processing are available in the chapter data table (Table 3.SM.1).