Back chapter figures
Figure 3.35
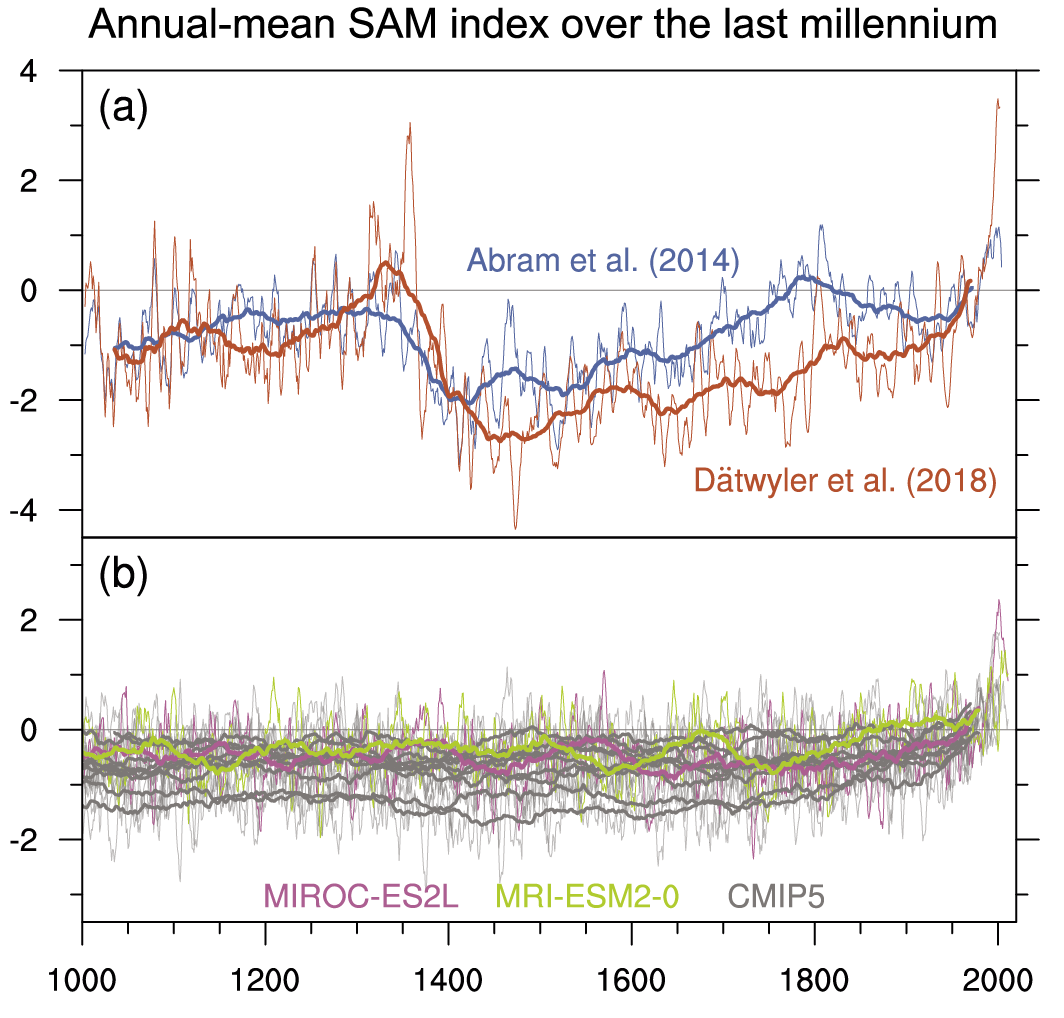
Figure caption
Figure 3.35 | Southern Annular Mode (SAM) indices in the last millennium. (a) Annual-mean SAM reconstructions by Abram et al. (2014) and Dätwyler et al. (2018). (b) The annual-mean SAM index defined by Gong and Wang (1999) in CMIP5 and CMIP6 last millennium simulations extended by historical simulations. All indices are normalized with respect to 1961–1990 means and standard deviations. Thin lines and thick lines show seven-year and 70-year moving averages, respectively. Further details on data sources and processing are available in the chapter data table (Table 3.SM.1).