Back chapter figures
Figure 3.6
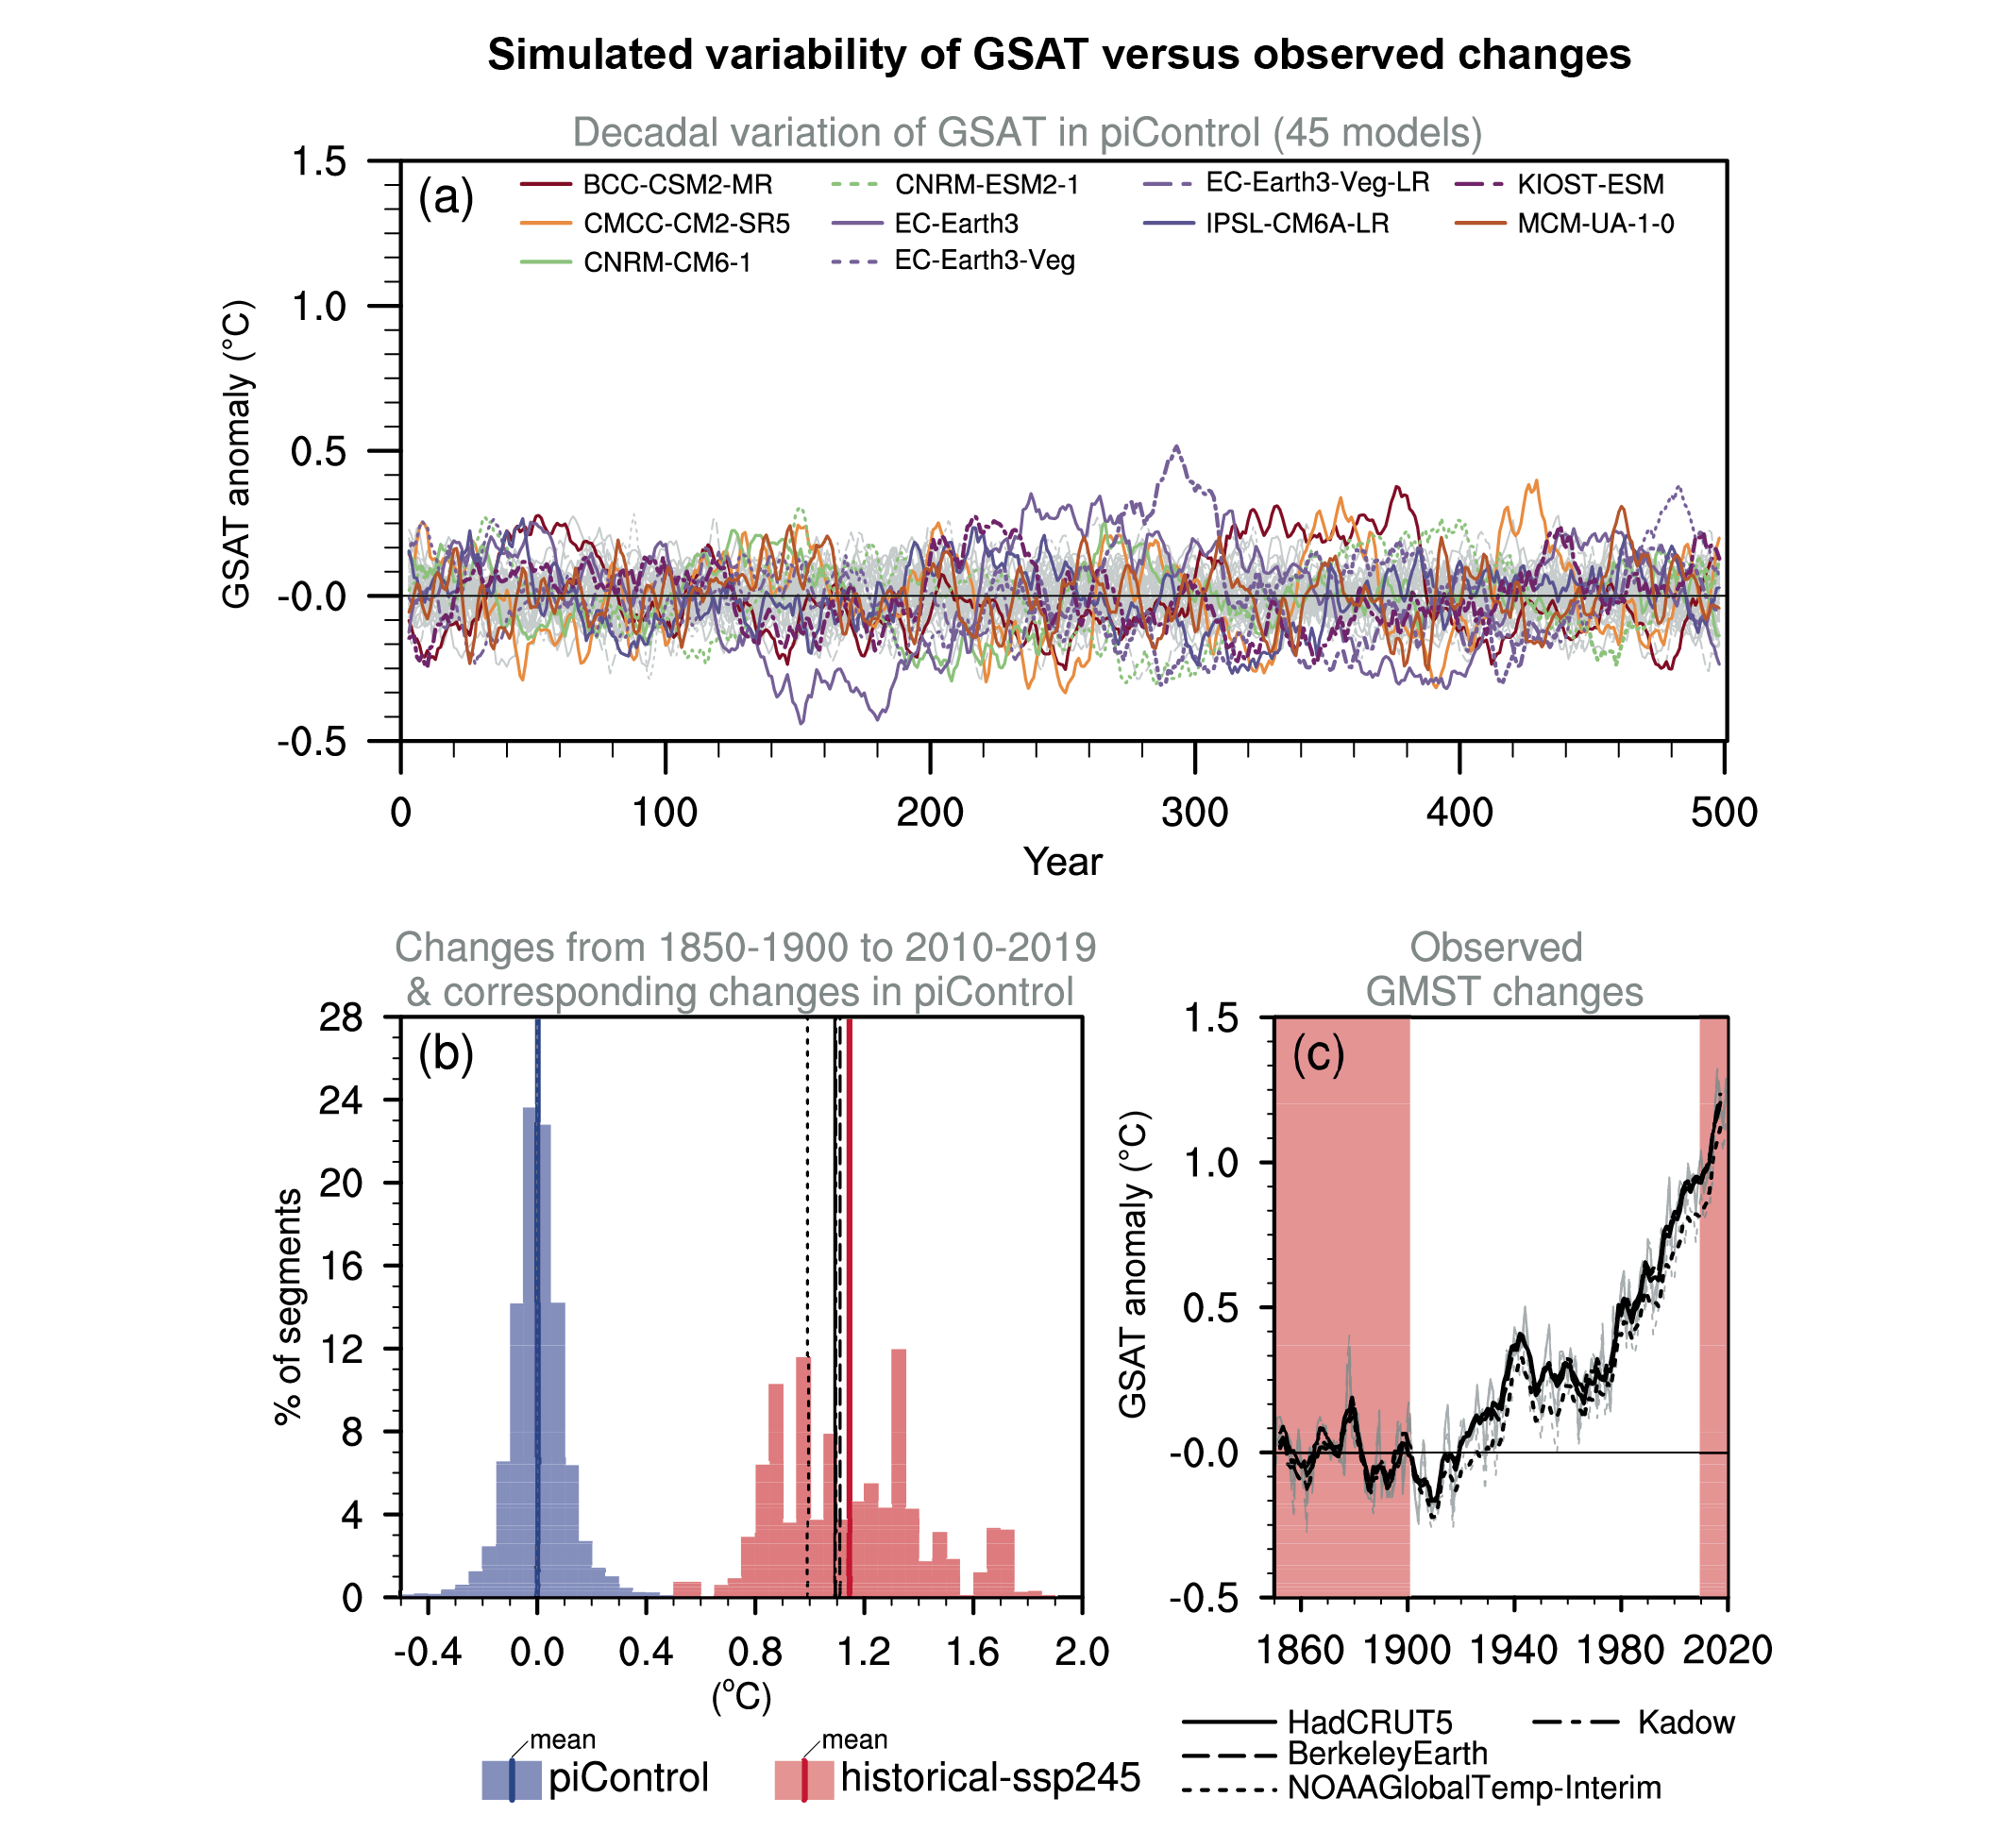
Figure caption
Figure 3.6 | Simulated internal variability of global surface air temperature (GSAT) versus observed changes. (a) Time series of five-year running mean GSAT anomalies in 45 CMIP6 pre-industrial control (unforced) simulations. The 10 most variable models in terms of five-year running mean GSAT are coloured according to the legend on Figure 3.4. (b) Histograms of GSAT changes in CMIP6 historical simulations (extended by using SSP2-4.5 simulations) from 1850–1900 to 2010–2019 are shown by pink shading in (c), and GSAT changes between the average of the first 51 years and the average of the last 20 years of 170-year overlapping segments of the pre-industrial control simulations shown in (a) are shown by blue shading. GMST changes in observational datasets for the same period are indicated by black vertical lines. (c) Observed GMST anomaly time series relative to the 1850–1900 average. Black lines represent the five-year running means while grey lines show unfiltered annual time series. Further details on data sources and processing are available in the chapter data table (Table 3.SM.1).