Box 4.1 Figure 1
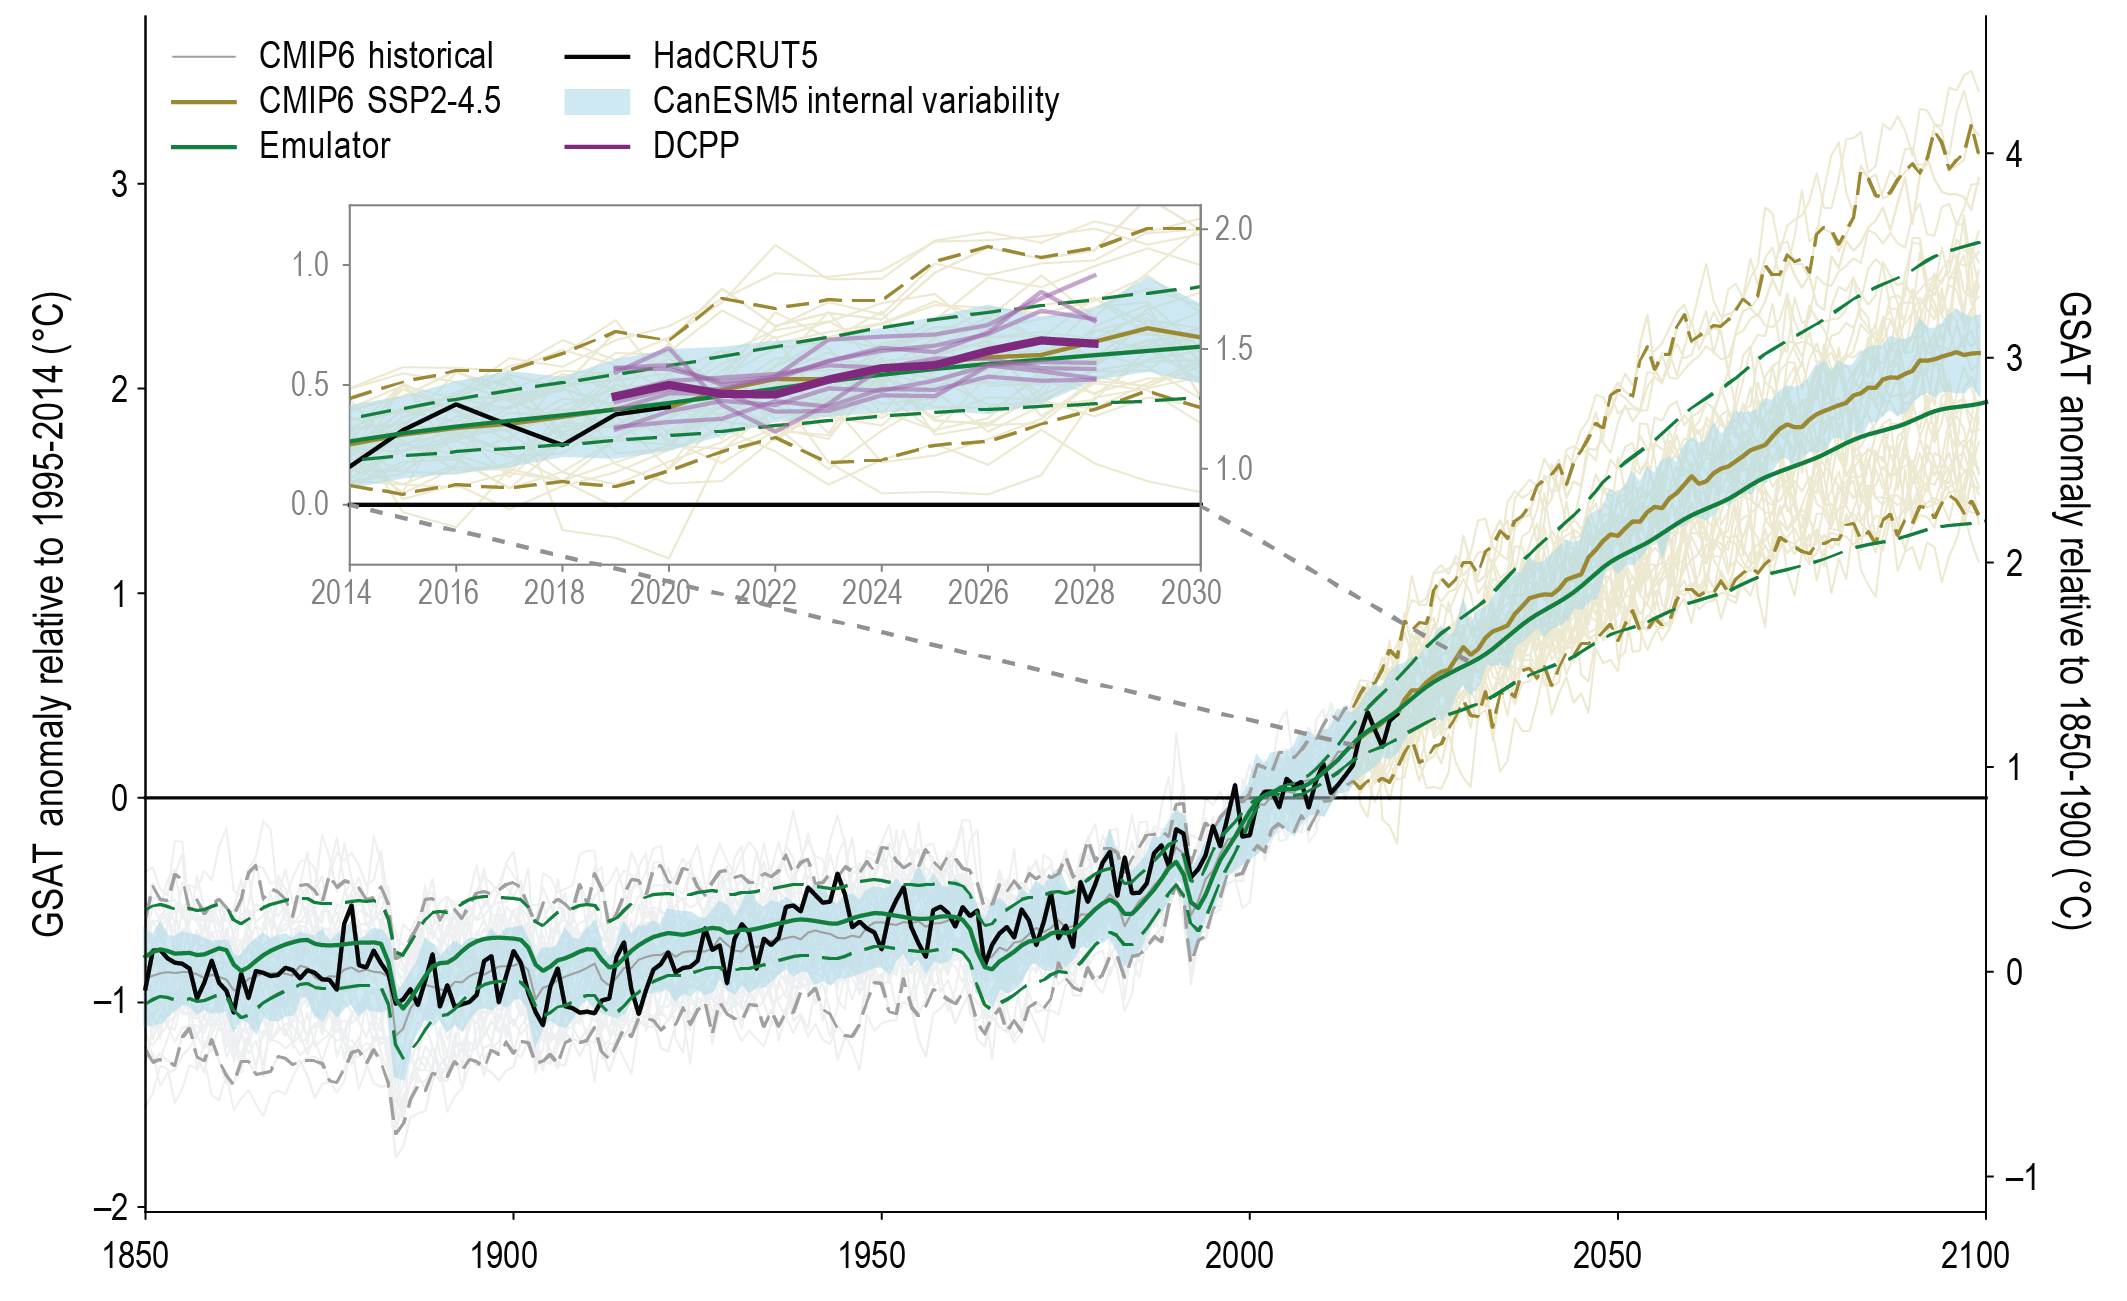
Figure caption
Box 4.1 Figure 1 | CMIP6 annual mean global surface air temperature (GSAT) simulations and various contributions to uncertainty in the projections ensemble. The figure shows anomalies relative to the period 1995–2014 (left y-axis), converted to anomalies relative to 1850–1900 (right y-axis); the difference between the y-axes is 0.85°C (Cross-Chapter Box 2.3). Shown are historical simulations with 39 CMIP6 models (grey) and projections following scenario SSP2-4.5 (dark yellow; thin lines: individual simulations; heavy line; ensemble mean; dashed lines: 5% and 95% ranges). The black curve shows the observations-based estimate (HadCRUT5; Morice et al., 2021). Light blue shading shows the 50-member ensemble CanESM5, such that the deviations from the CanESM5 ensemble mean have been added to the CMIP6 multi-model mean. The green curves are from the emulator and show the central estimate (solid) and very likely range (dashed) for GSAT. The inset shows a cut-out from the main plot and additionally in light purple for the period 2019–2028 the initialized forecasts from eight models contributing to DCPP (