Back chapter figures
FAQ 4.2, Figure 1
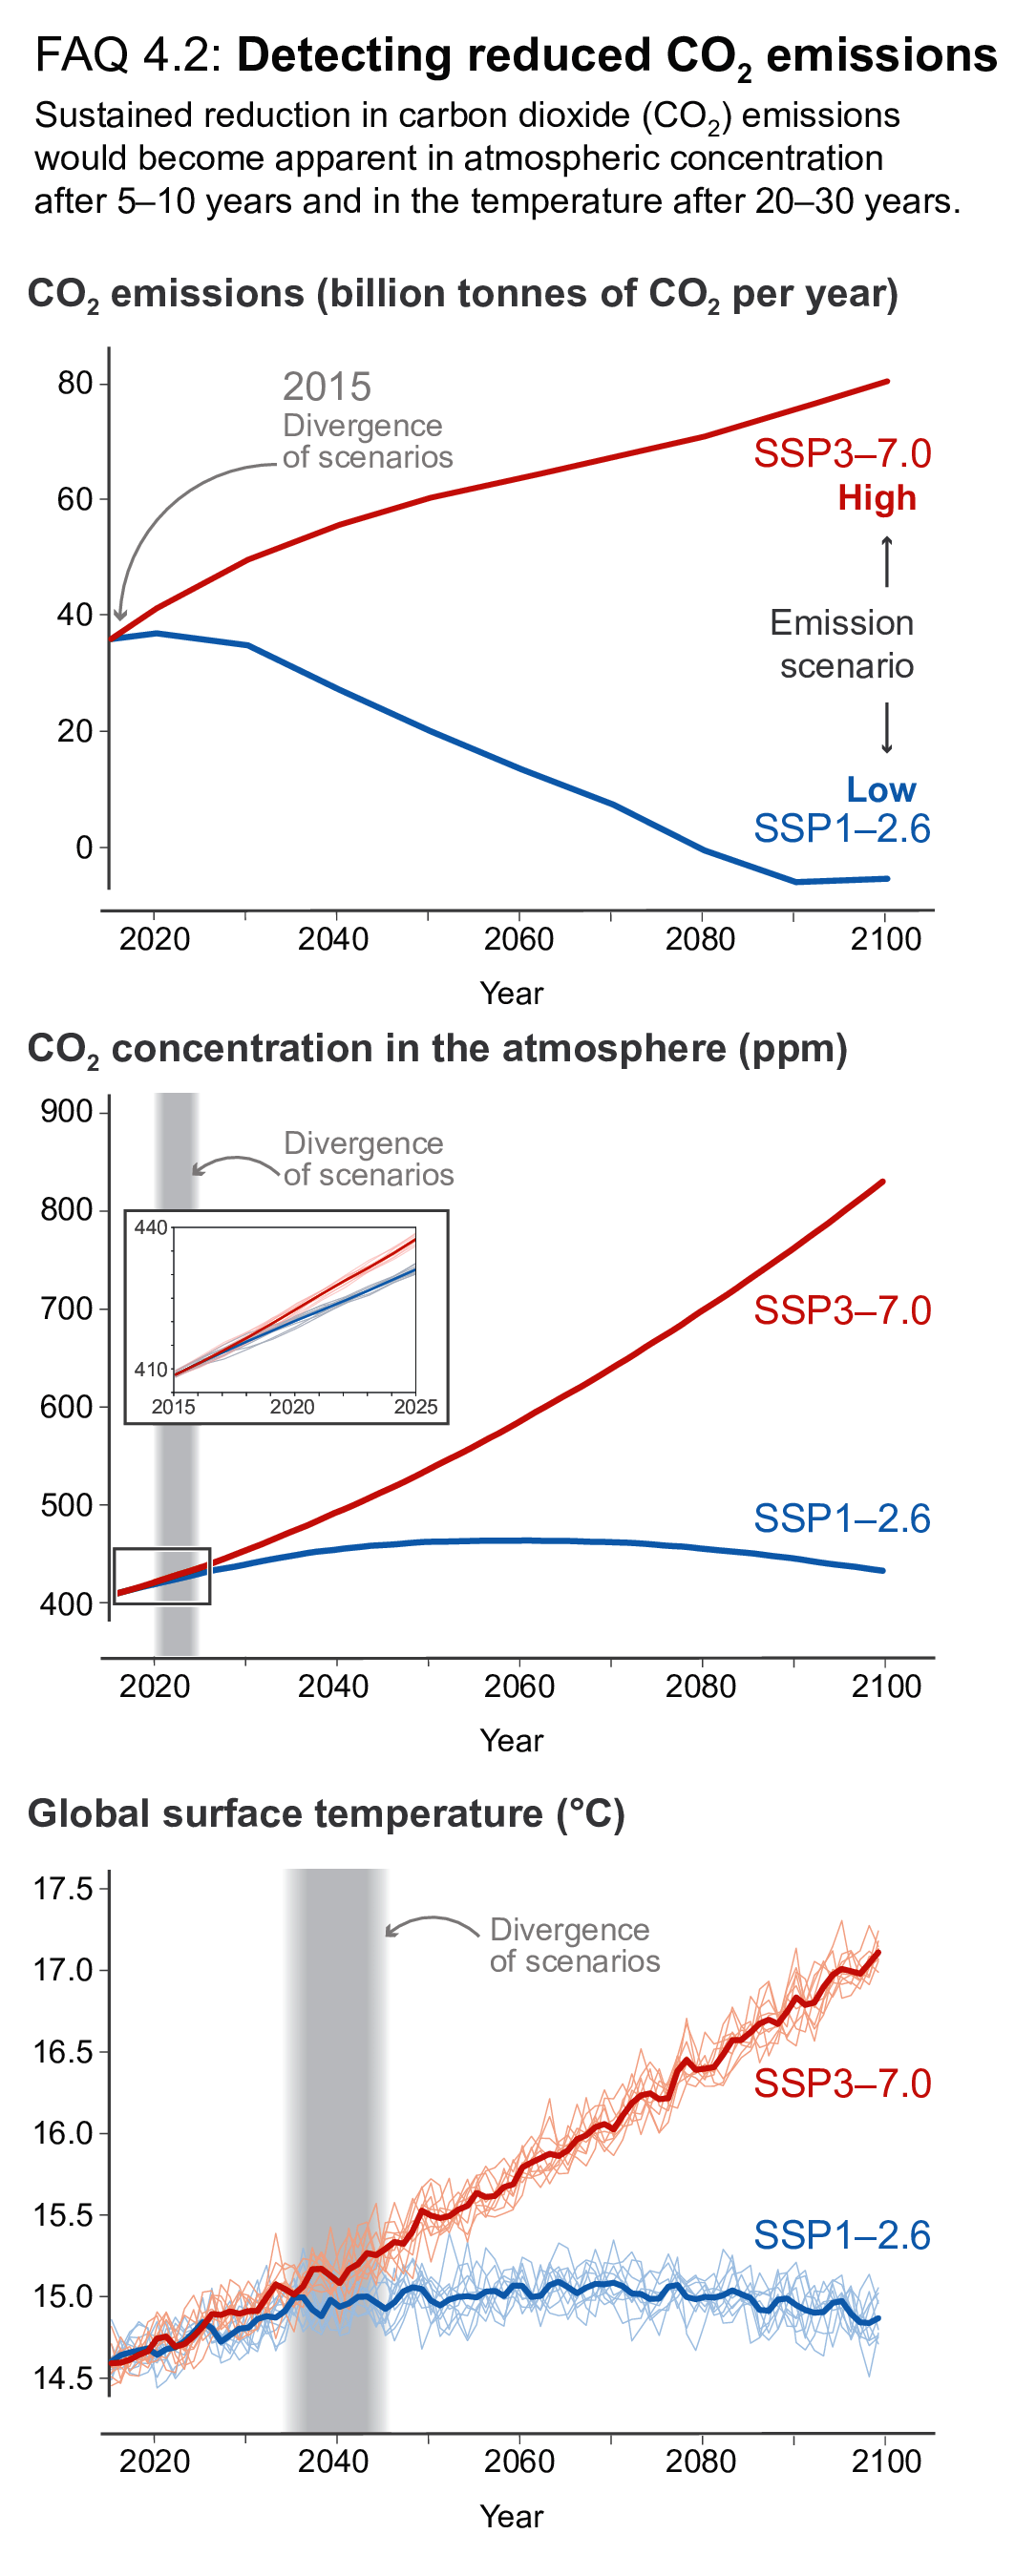
Figure caption
FAQ 4.2, Figure 1 | Observing the benefits of emissions reductions. (Top) Carbon dioxide (CO2) emissions, (middle) CO2 concentration in the atmosphere and (bottom) effect on global surface temperature for two scenarios: a low-emissions scenario (SSP1-2.6, blue) and a high-emissions scenario (SSP3-7.0). In the low-emissions scenario, CO2 emissions begin to decrease in 2020 whereas they keep increasing throughout the 21st century in the high-emissions scenario. The thick lines are the average of the 10 individual simulations (thin line) for each scenario. Differences between individual simulations reflect natural variability.