Back chapter figures
Figure 4.11
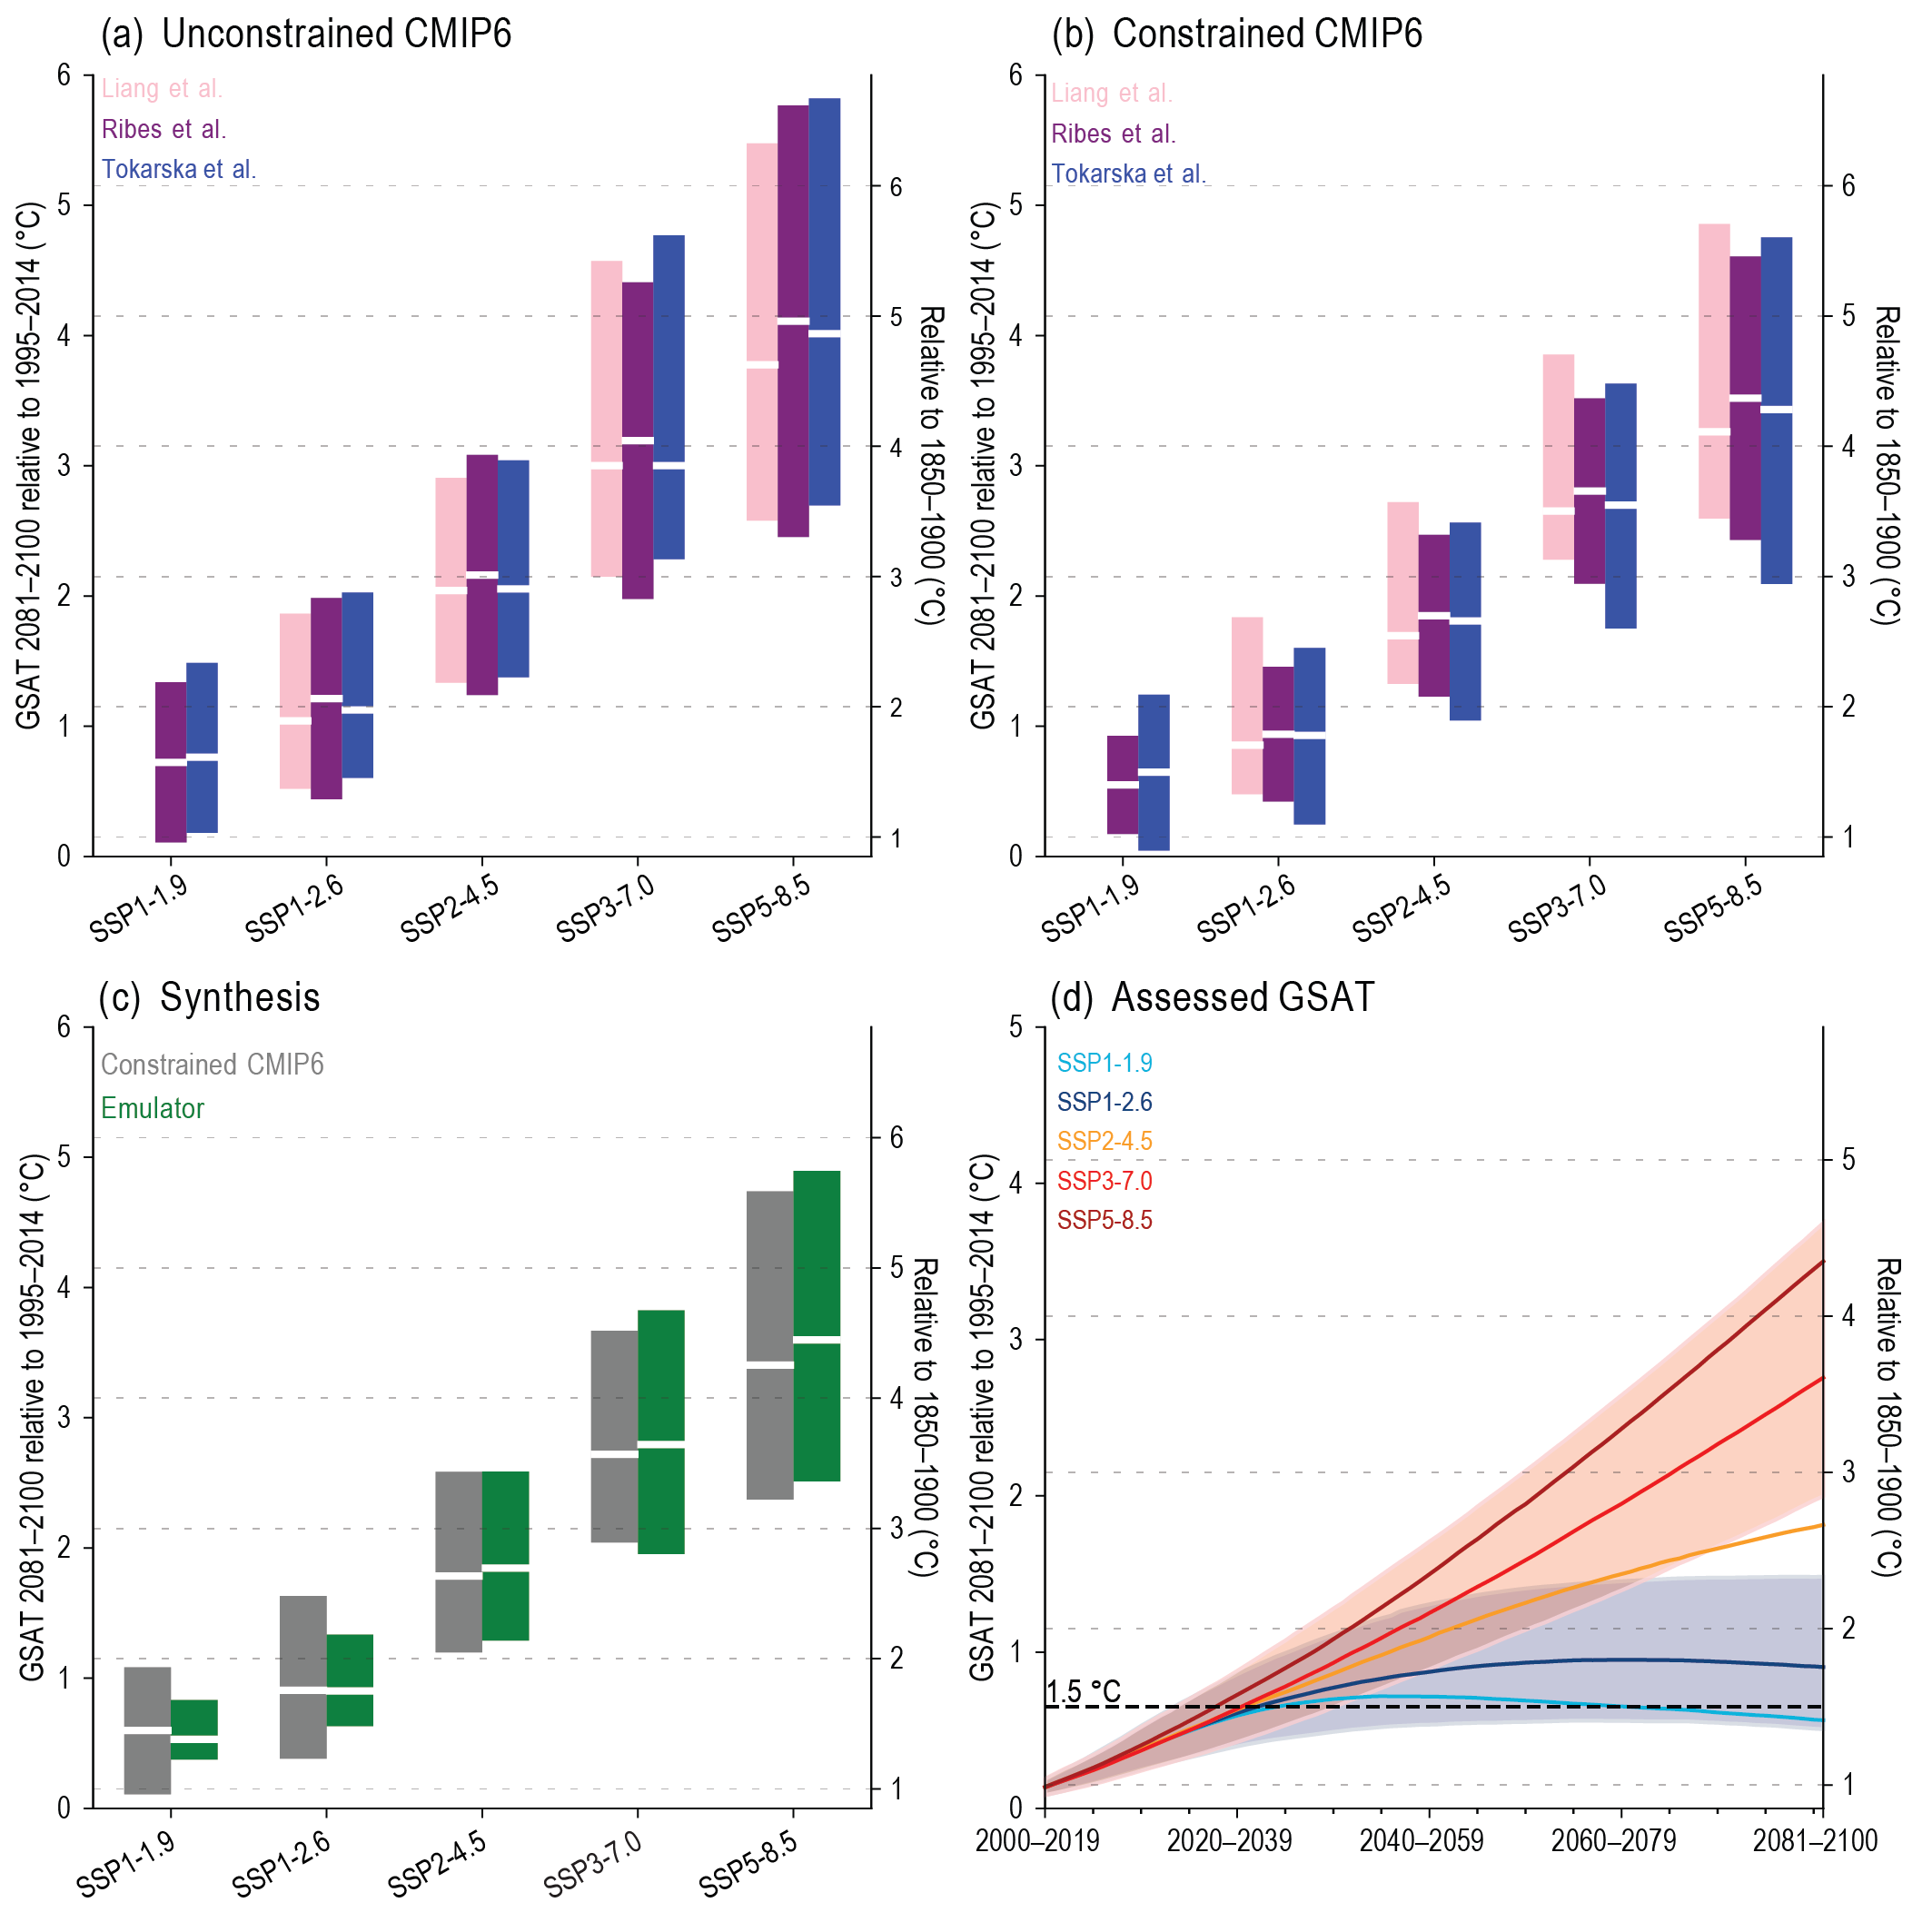
Figure caption
Figure 4.11 | Multiple lines of evidence for global surface air temperature (GSAT) changes for the long-term period, 2081–2100, relative to the average over 1995–2014, for all five priority scenarios. The unconstrained CMIP6 5–95% ranges (coloured bars) in (a) differ slightly because different authors used different subsamples of the CMIP6 archive. The constrained CMIP6 5–95% ranges (coloured bars) in (b) are smaller than the unconstrained ranges in (a) and differ because of different samples from the CMIP6 archive and because different observations and methods are used. In (c), the average of the ranges in (b) is formed (grey bars). Green bars in (c) show the emulator ranges, defined such that the best estimate, lower bound of the very likely range, and upper bound of the very likely range of climate feedback parameter and ocean heat uptake coefficient take the values that map onto the corresponding values of ECS and TCR of Section 7.5 (see Box 4.1). The time series in (d) are constructed by taking the average of the constrained CMIP6 ranges and the emulator ranges. The y-axes on the right-hand side are shifted upward by 0.85°C, the central estimate of the observed warming for 1995–2014, relative to 1850–1900 (Cross-Chapter Box 2.3, Table 1). Further details on data sources and processing are available in the chapter data table (Table 4.SM.1).