Back chapter figures
Figure 4.26
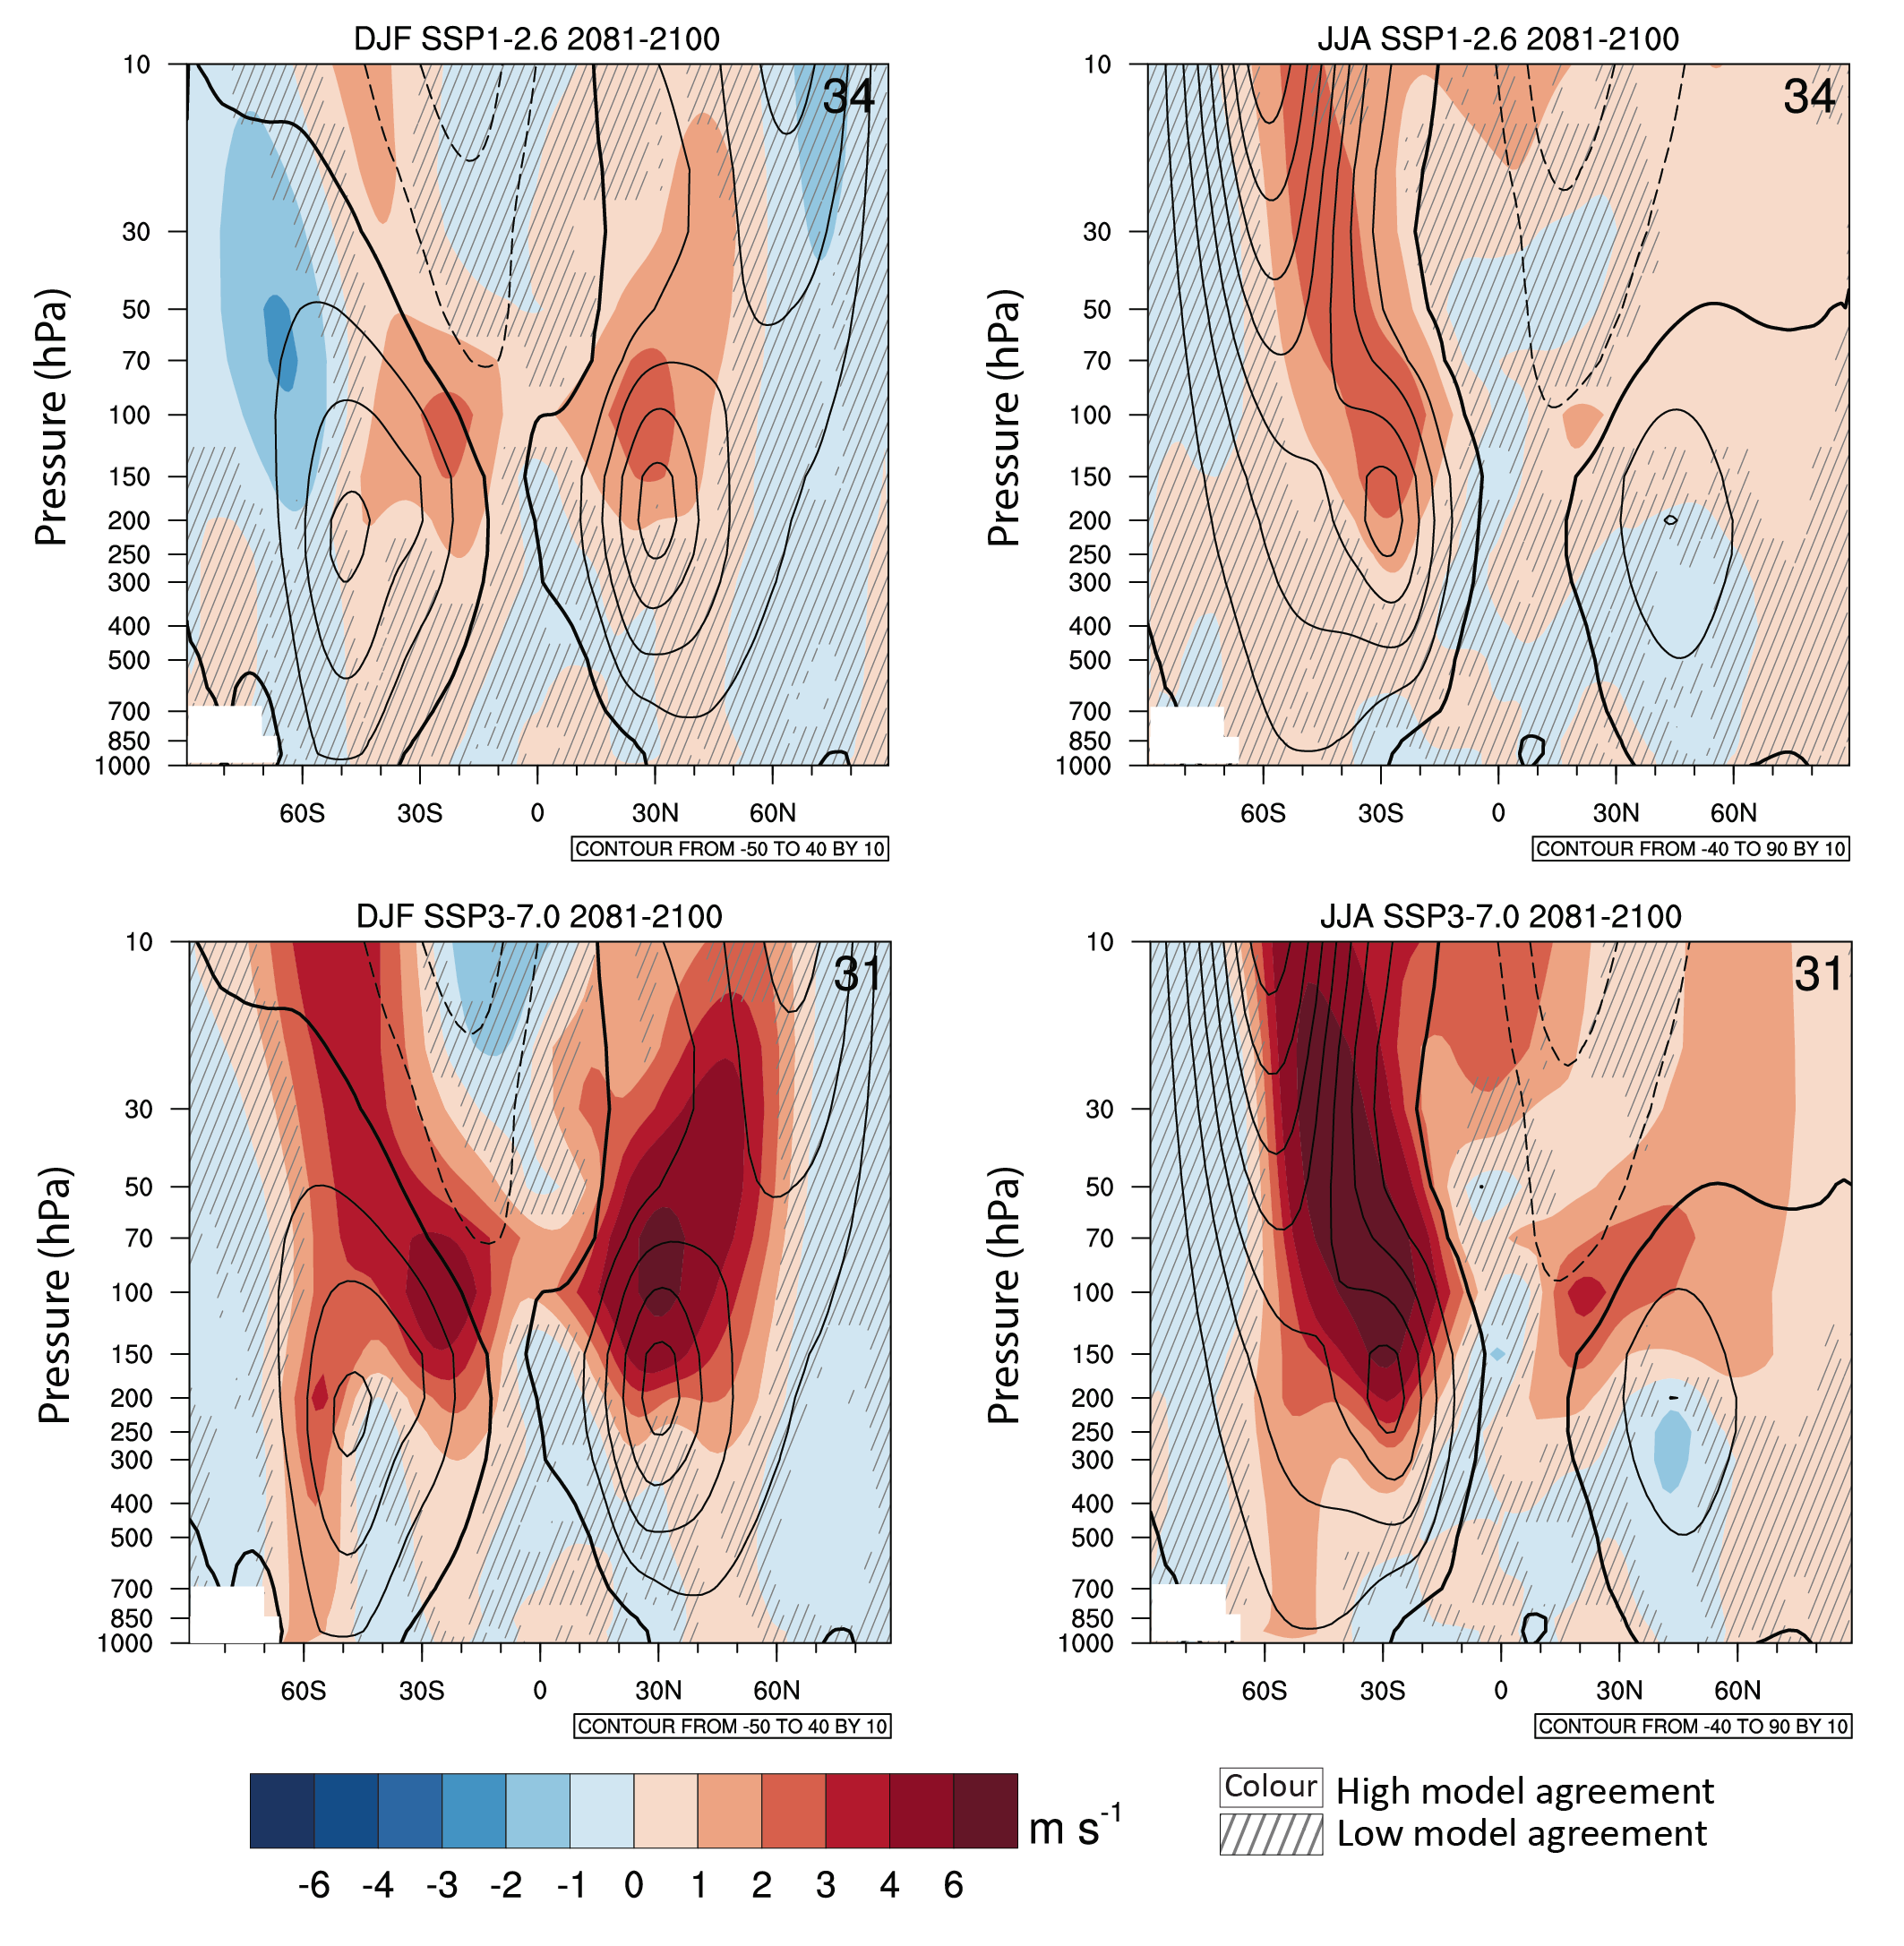
Figure caption
Figure 4.26 | Long-term change of zonal-mean, zonal wind. Displayed are multi-model mean changes in (left) boreal winter(December–January–February, DJF) and (right) austral winter (June–July–August, JJA) zonal mean, zonal wind (m s–1) in 2081–2100 for (top) SSP1-2.6 and (bottom) SSP3-7.0 relative to 1995–2014. The 1995–2014 climatology is shown in contours with spacing 10 m s–1. Diagonal lines indicate regions where less than 80% of the models agree on the sign of the change and no overlay where at least 80% of the models agree on the sign of the change. Further details on data sources and processing are available in the chapter data table (Table 4.SM.1).