Back chapter figures
Figure 4.28
Figure caption
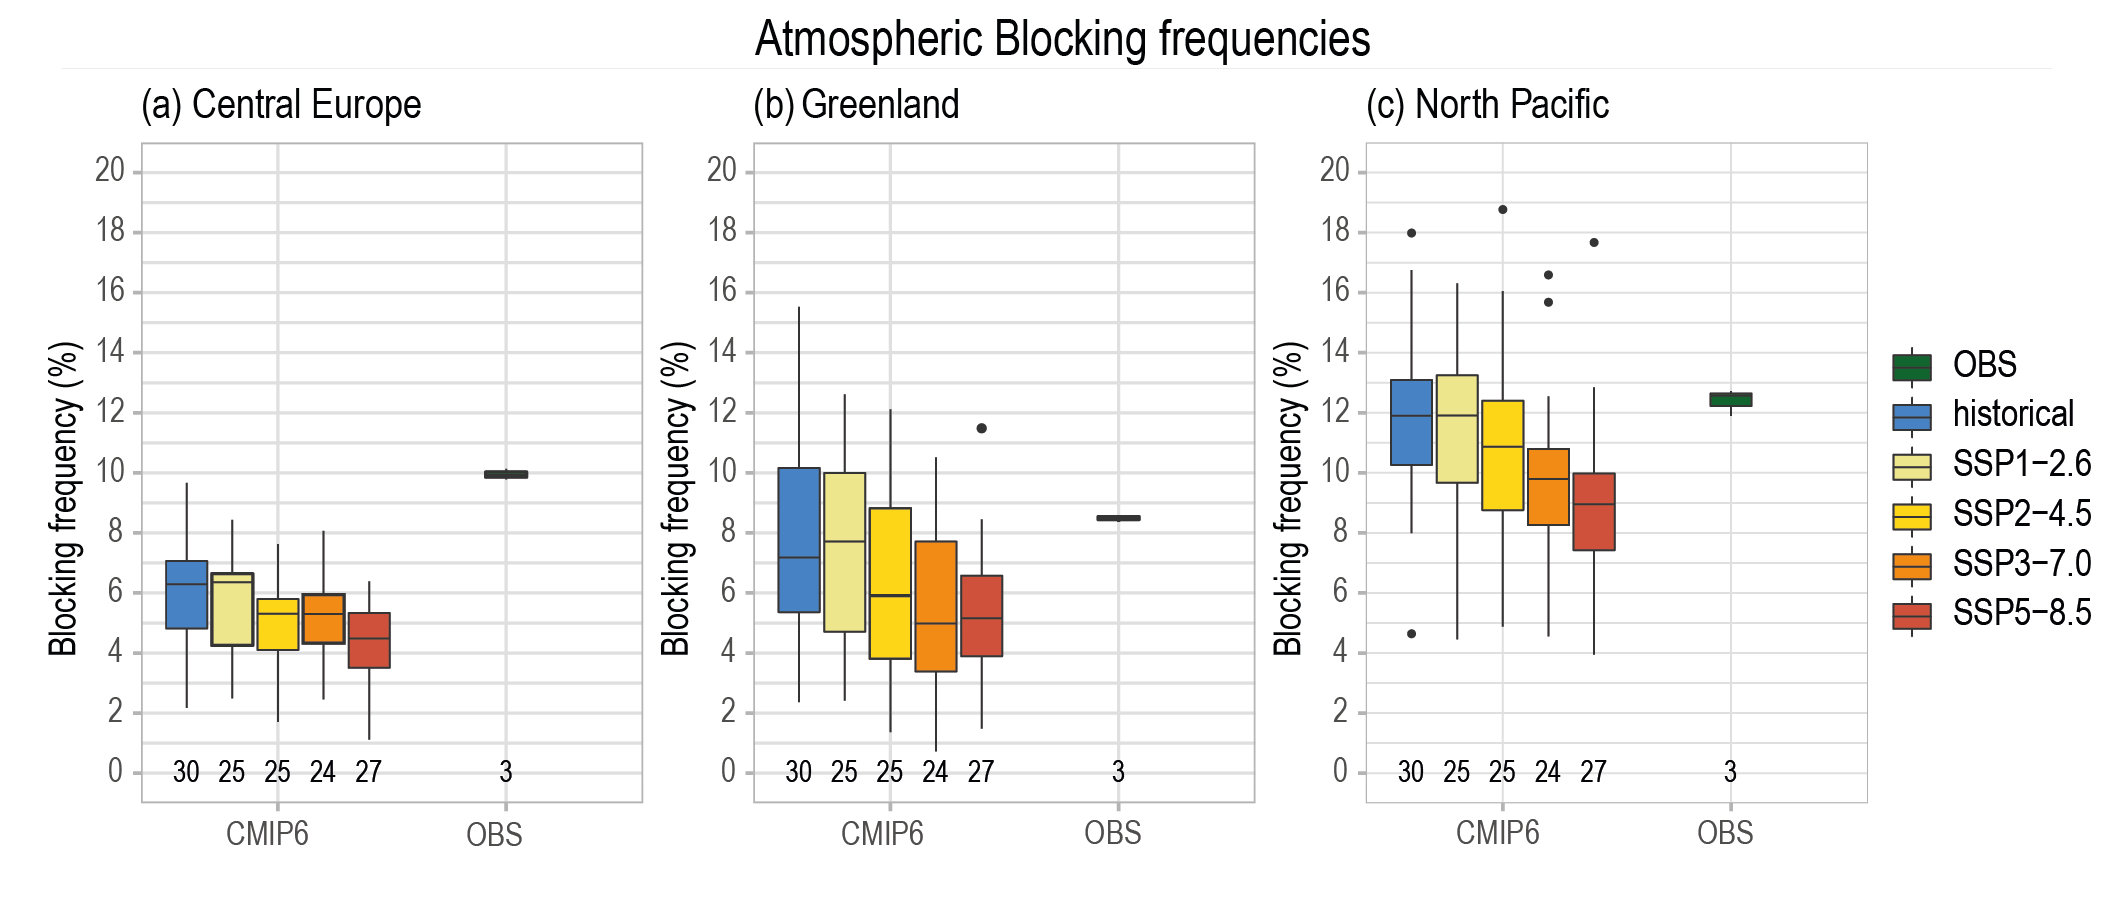
Figure 4.28 | Projected winter atmospheric blocking frequencies. Box plot showing December –March atmospheric blocking frequencies from historical simulations over 1995–2014 and projections over 2081–2100, over (a) the Central European region (20°W–20°E, 45°N–65°N); (b) the Greenland region (65°W–20°W, 62.5°N–72.5°N); (c) the North Pacific region (130°E–150°W, 60°N–75°N). Values show the percentage of blocked days per season following the (Davini et al., 2012) index. Median values are the thick black horizontal bar. The lower whiskers extend from the first quartile to the smallest value in the ensemble, and the upper whiskers extend from the third quartile to the largest value. The whiskers are limited to an upper bound that is 1.5 times the interquartile range (the distance between the third and first quartiles). Black dots show outliers from the whiskers. The numbers below each bar report the number of models included. Observationally-based values are obtained as the average of the ERA-Interim Reanalysis, the JRA-55 Reanalysis and the NCEP/NCAR Reanalysis. Adapted from Davini and D’Andrea (2020). Further details on data sources and processing are available in the chapter data table (Table 4.SM.1).
