Back chapter figures
Figure 4.35
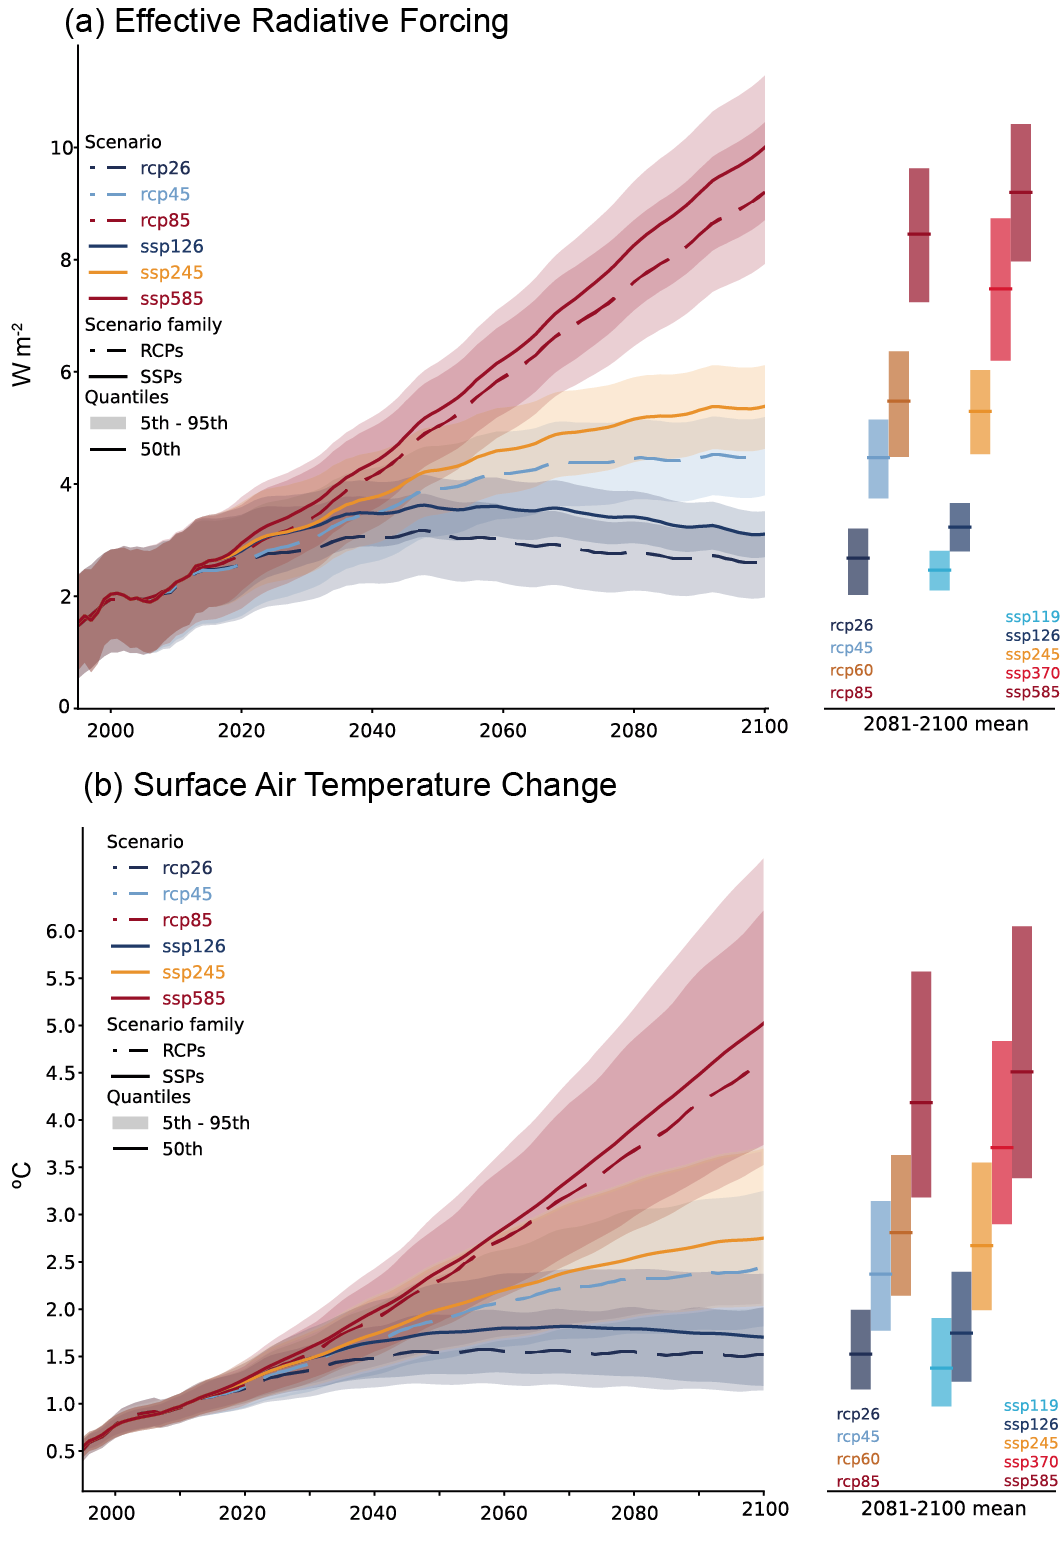
Figure caption
Figure 4.35 | Comparison of RCPs and SSPs run by a single emulator to estimate scenario differences. Time series with 5–95% ranges and medians of (a) effective radiative forcings, calculated as described in Annex 7.A.1; and (b) global surface air temperature projections relative to 1850–1900 for the RCP and SSP scenarios from MAGICC 7.5. Note that the nameplate radiative forcing level refers to stratospheric adjusted radiative forcings in AR5-consistent settings (Tebaldi et al., 2021) while ERFs may differ. MAGICC7.5 is here run in the recommended setup for WGIII, prescribing observed GHG concentrations for the historical period and switching to emissions-driven runs in 2015. Further details on data sources and processing are available in the chapter data table (Table 4.SM.1).