Back chapter figures
Figure 4.4
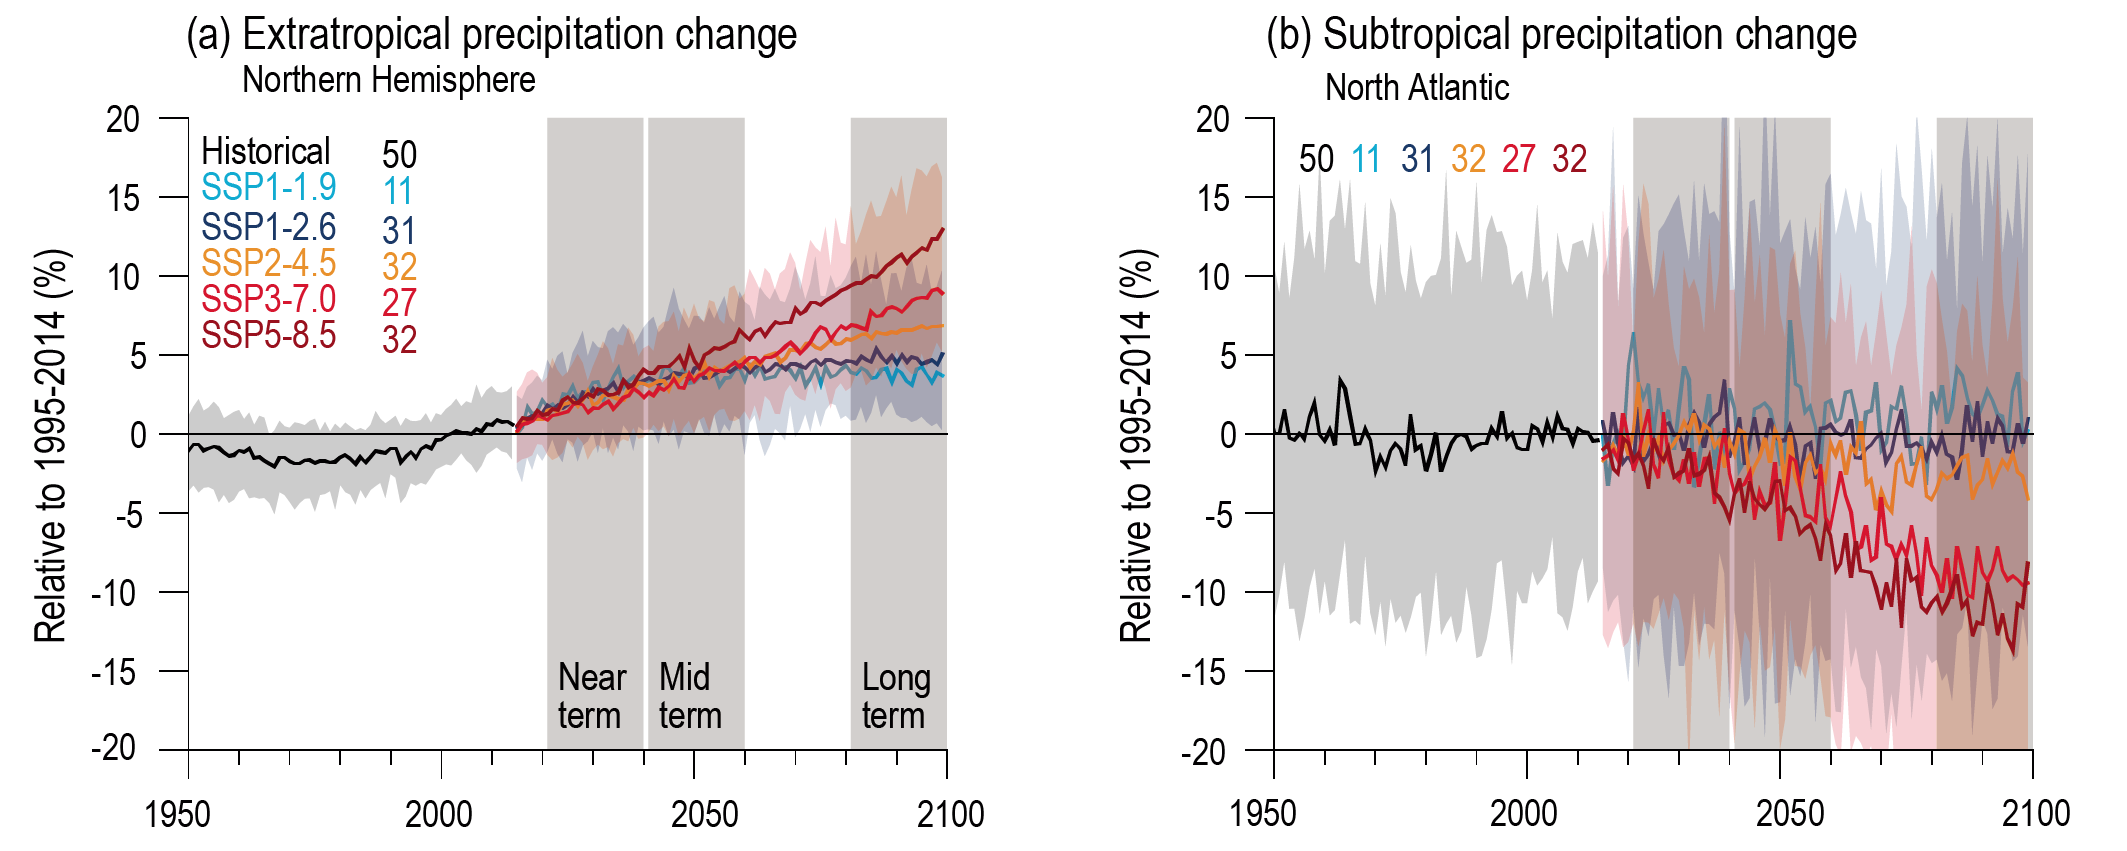
Figure caption
Figure 4.4 | CMIP6 annual mean precipitation changes (%) from historical and scenario simulations. (a) Northern Hemisphere extratropics (30°N–90°N). (b) North Atlantic subtropics (5°N–30°N, 80°W–0°). Changes are relative to 1995–2014 averages. Displayed are multi-model averages and, in parentheses, 5–95% ranges. The numbers inside each panel are the number of model simulations. Results are derived from concentration-driven simulations. Further details on data sources and processing are available in the chapter data table (Table 4.SM.1).