Back chapter figures
Figure 4.41
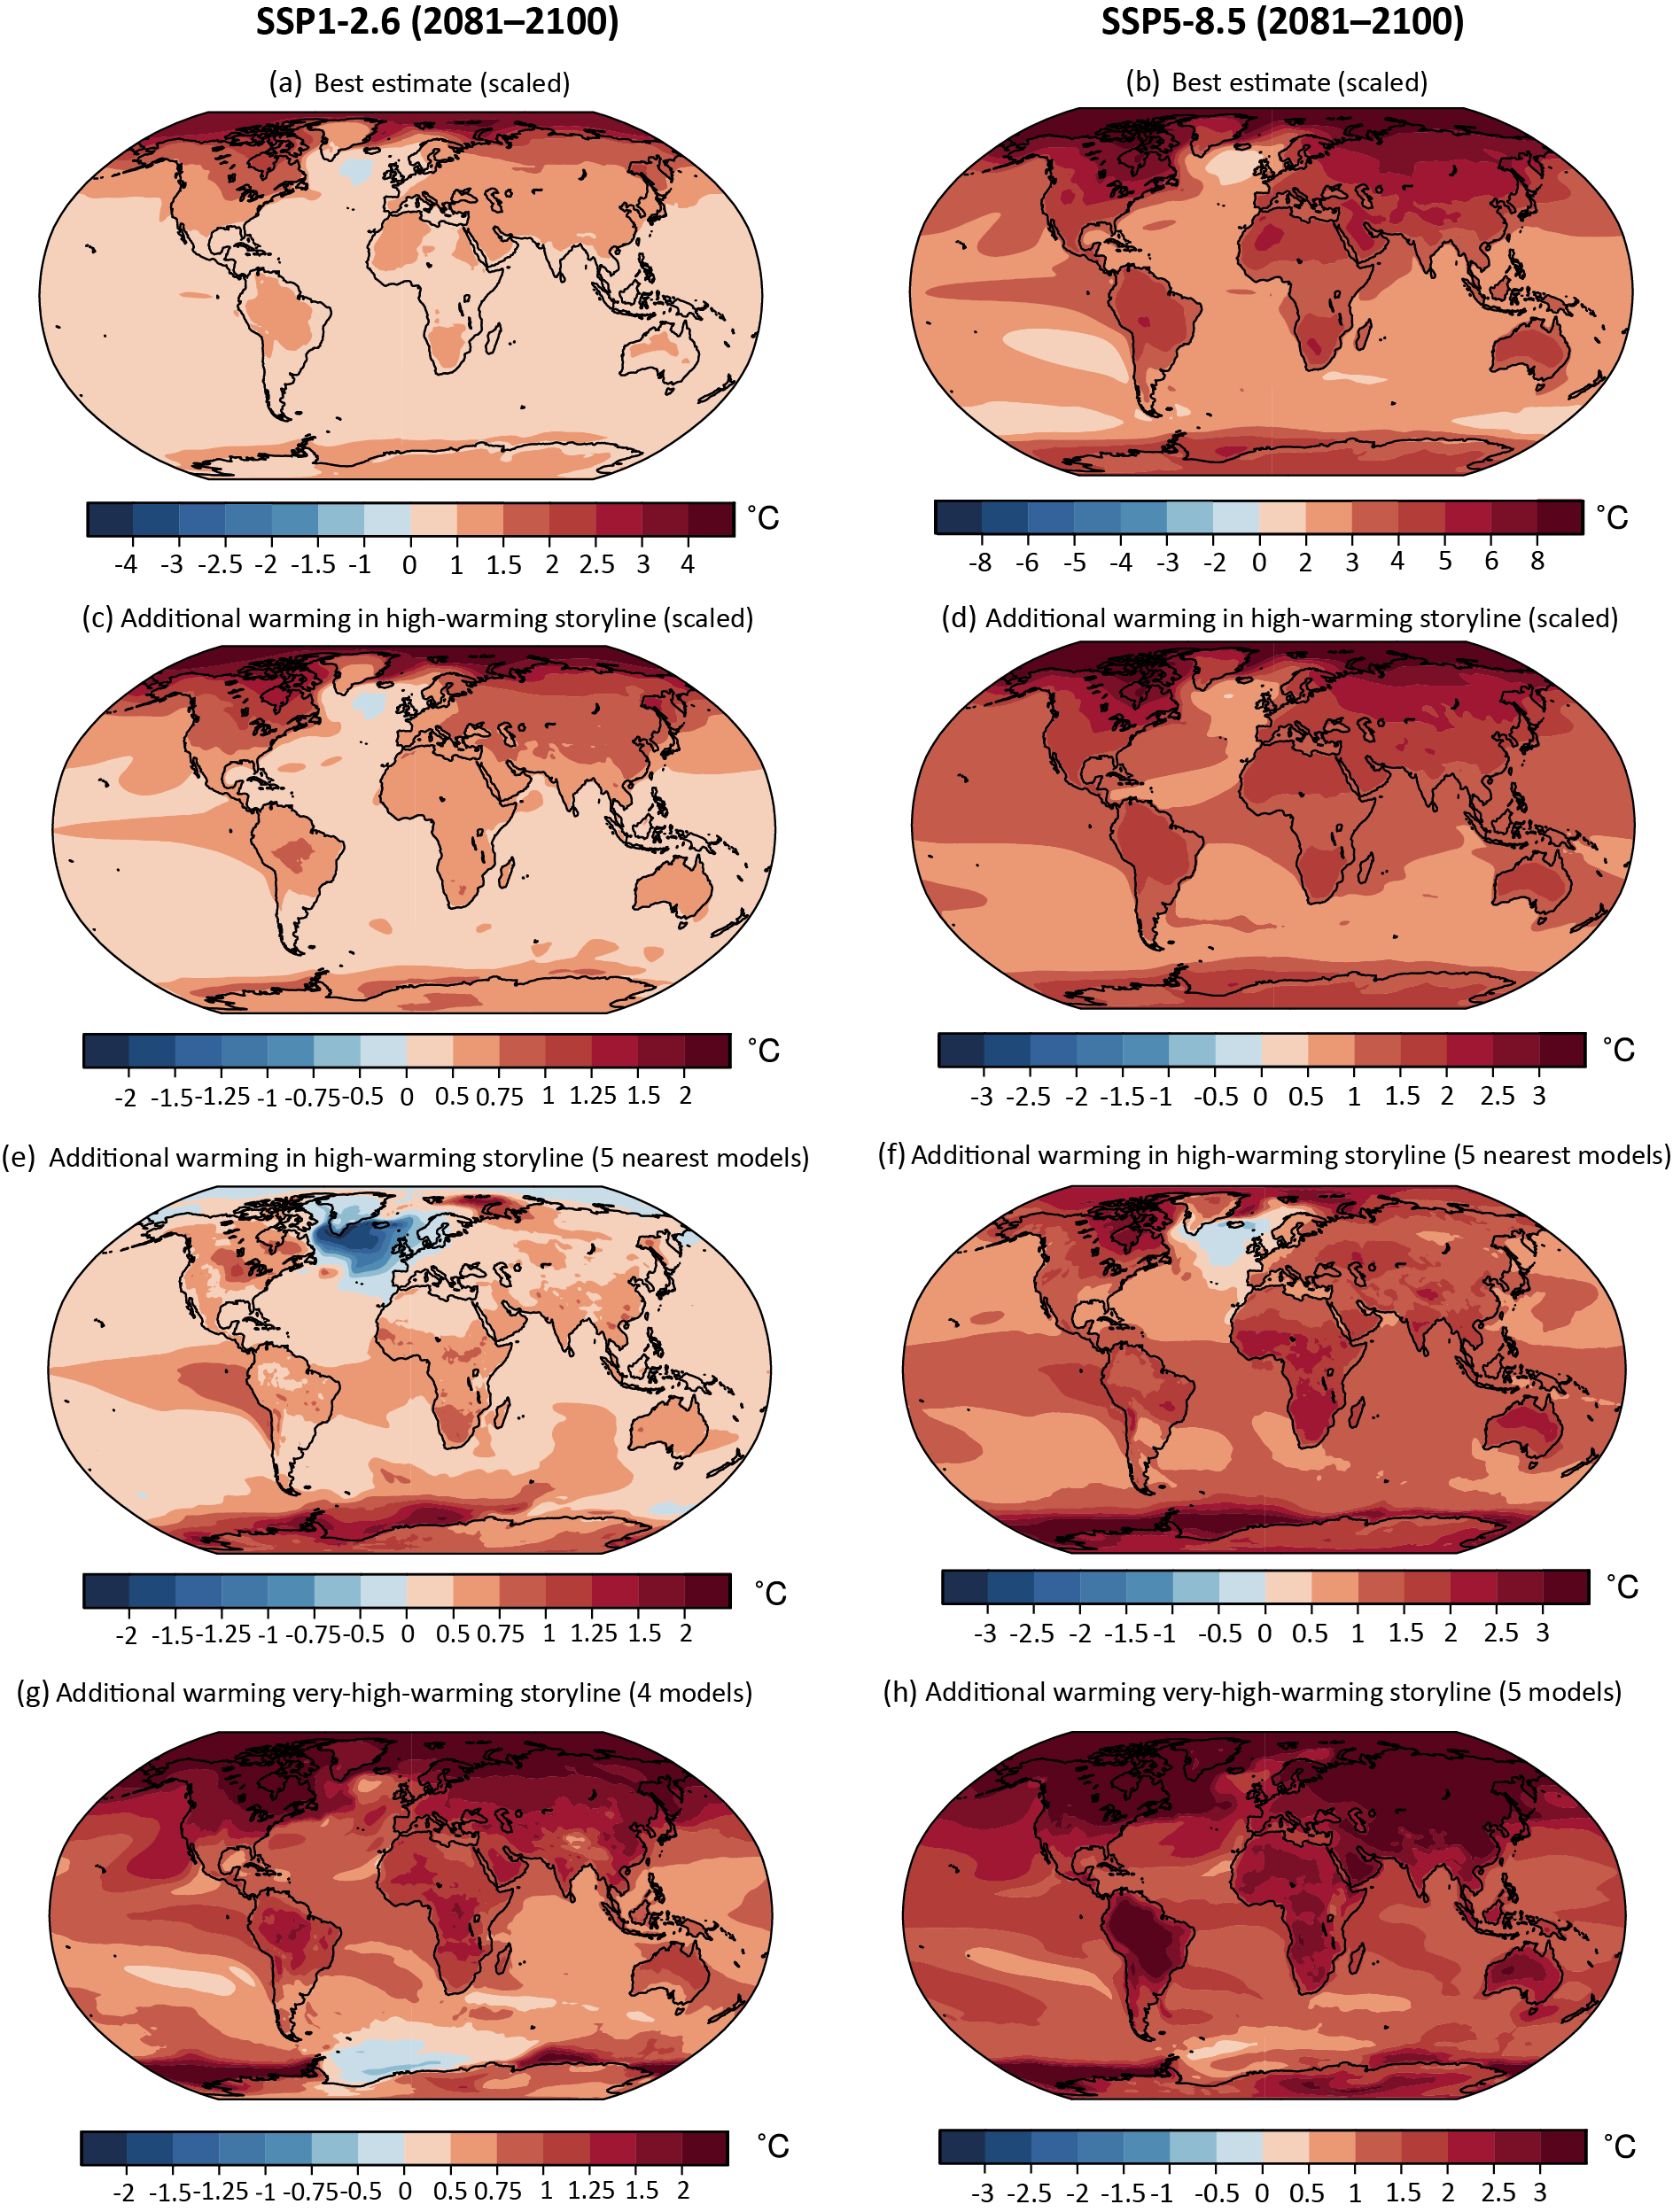
Figure caption
Figure 4.41 | High-warming storylines for changes in annual mean temperature. (a, b) Changes in 2081–2100 relative to 1995–2014 consistent with the assessed best global surface air temperature (GSAT) estimate (0.9°C and 3.5°C relative to 1995–2014 for SSP1-2.6 and SSP5-8.5, respectively). The CMIP6 multi-model mean is linearly pattern-scaled to the best GSAT estimate. (c–h) Annual mean warming above the best estimate, relative to panels (a) and (b) respectively; note the different colour bar in a high and very high-warming storyline for 2081–2100. (c, d) Multi-model mean warming pattern scaled to very high GSAT level corresponding to the upper bound of the assessed very likely range (4.8°C for SSP5-8.5 and 1.5°C for SSP1-2.6; see Section 4.3.4). (e, f) Average of five models with high GSAT warming nearest to the upper estimate of the very likely range (CESM2, CESM2-WACCM, CNRM-CM6-1, CNRM-CM6-1-HR, EC-Earth3 for SSP1-2.6 and ACCESS-CM2, CESM2, CESM2-WACCM, CNRM-CM6-1, CNRM-CM6-1-HRfor SSP5-8.5); (g, h) Average of four and five models, respectively (ACCESS-CM2, HadGEM3-GC31-LL, HadGEM3-GC31-MM, UKESM1-0-LL for SSP1-2.6 and CanESM5, CanESM5-CanOE, HadGEM3-GC31-LL: HadGEM3-GC31-MM, UKESM1-0-LL for SSP5-8.5) projecting very high GSAT warming exceeding the very likely range. Further details on data sources and processing are available in the chapter data table (Table 4.SM.1).