Back chapter figures
Figure 5.34
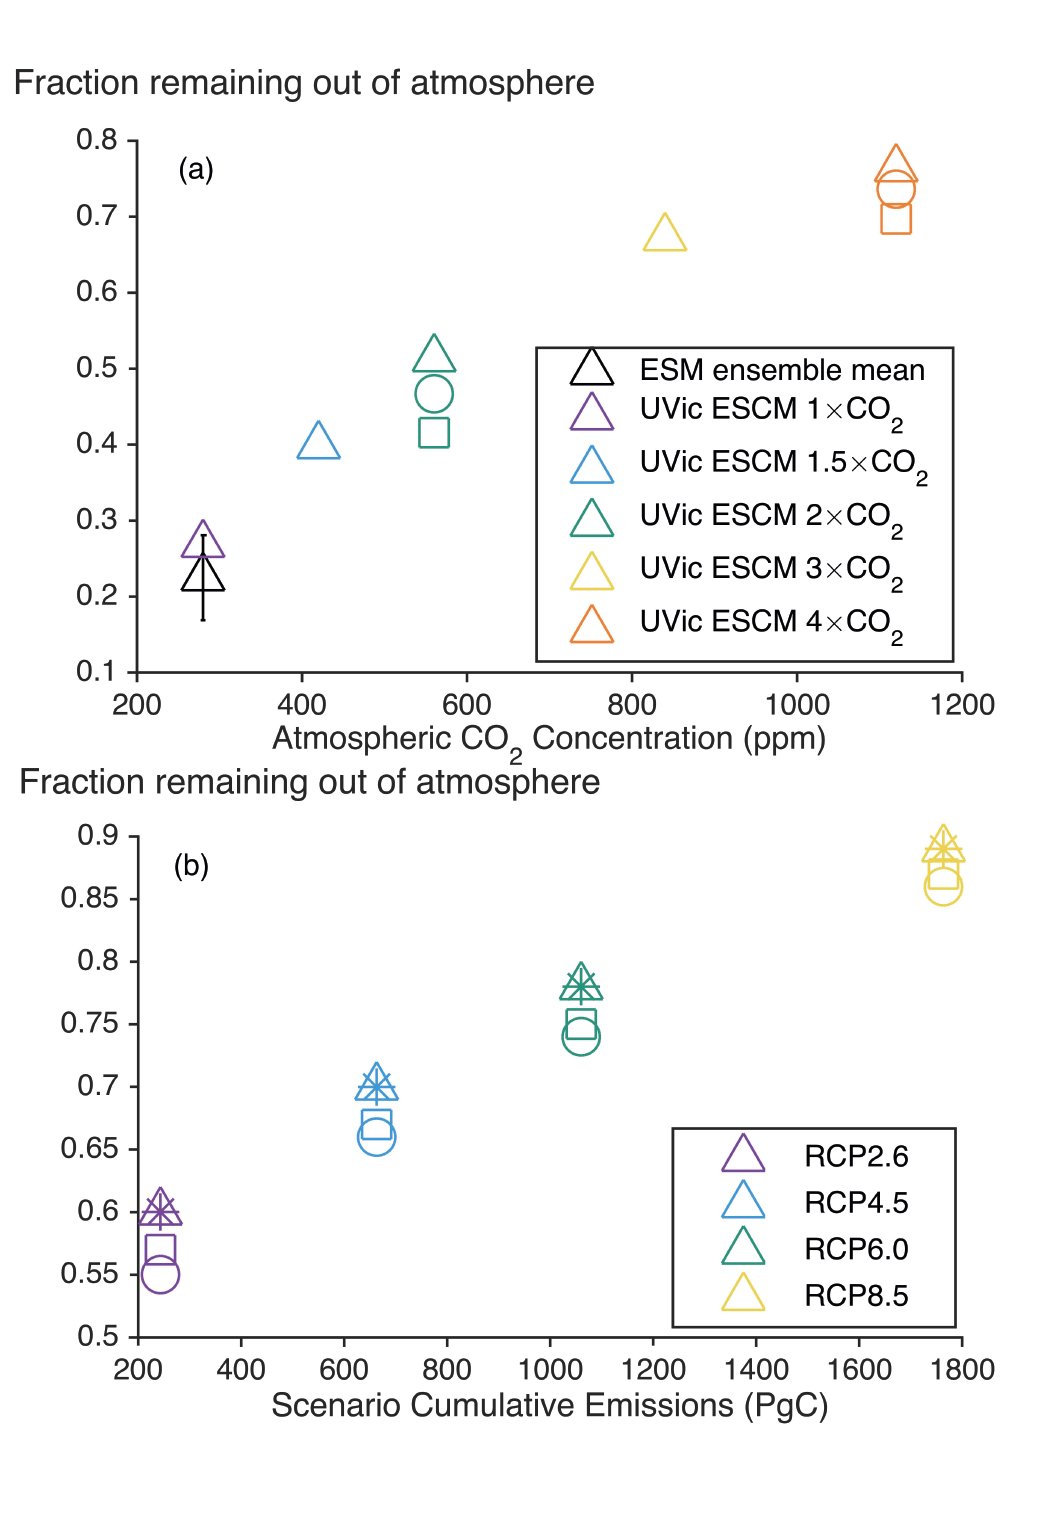
Figure caption
Figure 5.34 | Removal effectiveness of carbon dioxide removal (CDR). (a) Fraction of carbon dioxide (CO2) remaining out of the atmosphere for idealized model simulations with CDR applied instantly (pulse removals) from climate states in equilibrium with different atmospheric CO2 concentration levels (one to four times the pre-industrial atmospheric CO2 concentration; shown on the horizontal axis). The fraction is calculated 100 years after pulse removal. The black triangle and error bar indicate the multi-model mean and standard deviation for the seven Earth system models shown in Figure 5.32 forced with a 100 PgC pulse removal. Other symbols illustrate results with the UVic ESCM model of intermediate complexity for different magnitudes of pulse removals (triangles: –100 PgC; circles: –500 PgC; squares: –1000 PgC). Data for the UVic ESCM is from Zickfeld et al. (2021). (b) Perturbation airborne fraction (see text for definition) for model simulations where CDR is applied from four Representative Concentration Pathways (RCPs) (shown on the horizontal axis in terms of their cumulative CO2 emissions during 2020–2099). Symbols indicate results for four CDR scenarios, which differ in terms of the magnitude and rate of CDR (see Jones et al. (2016b) for details). Results are based on simulations with the Hadley Centre Simple Climate-Carbon Model and are shown for the year 2100. Data from Jones et al. (2016b). Further details on data sources and processing are available in the chapter data table (Table 5.SM.6).