Back chapter figures
Figure 5.6
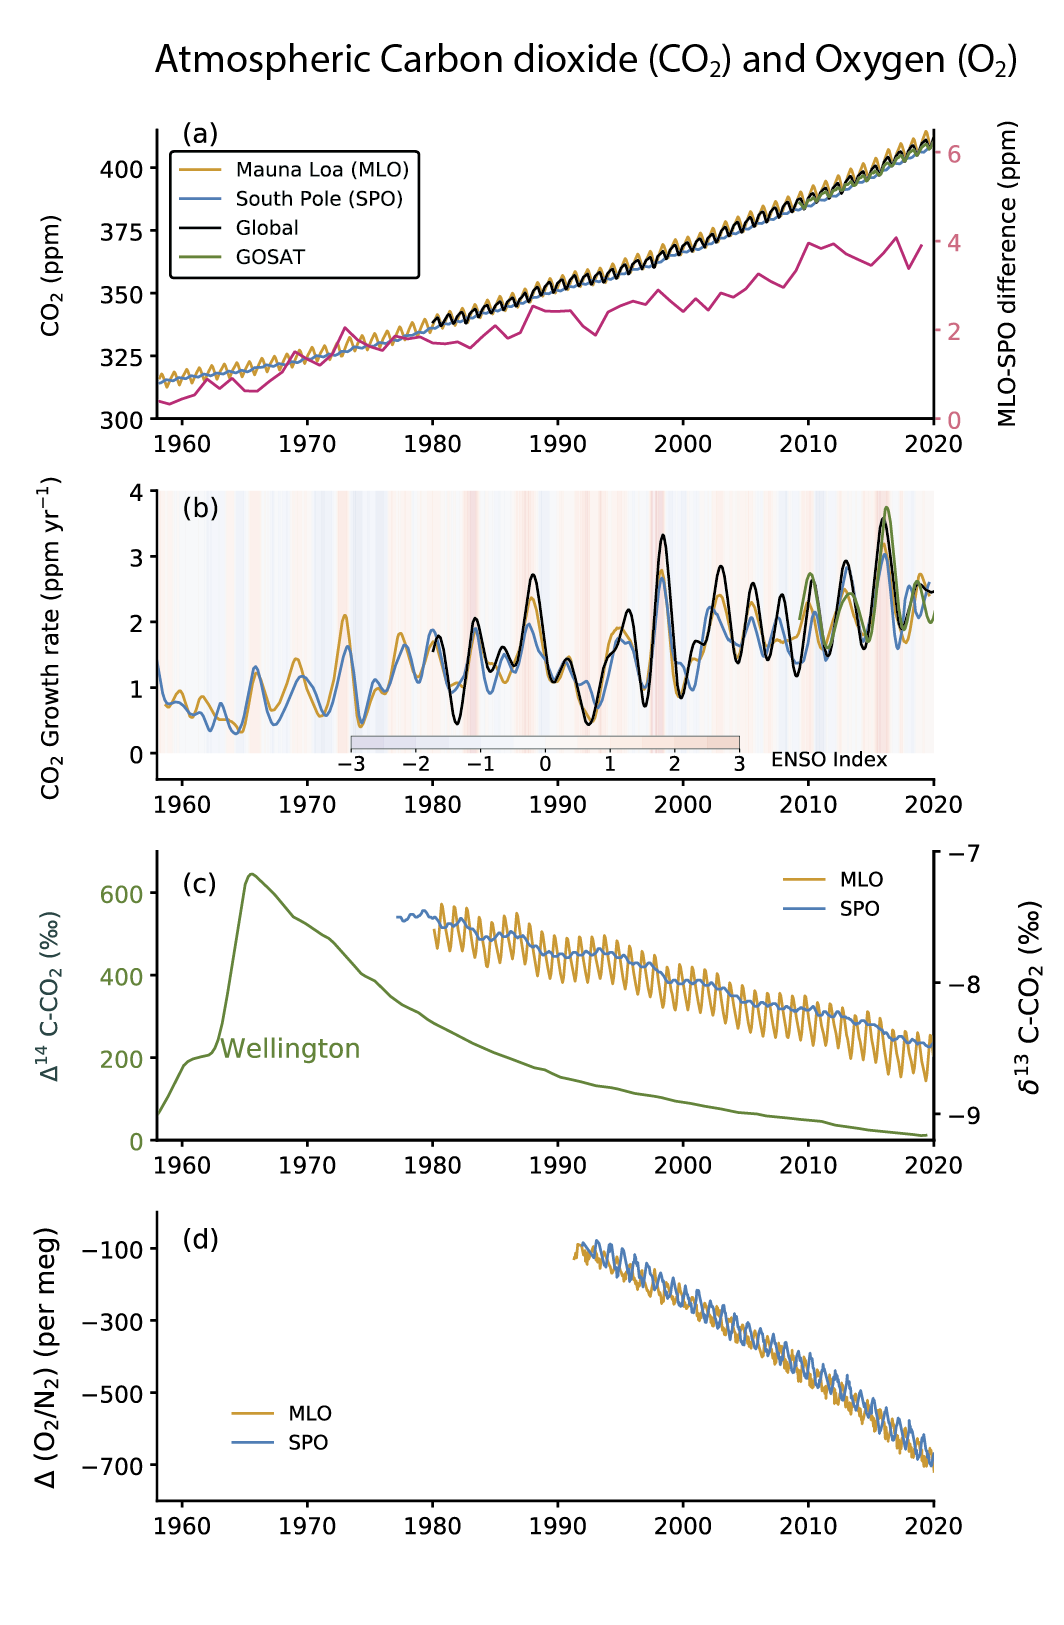
Figure caption
Figure 5.6 | Time series of CO2 concentrations and related measurements in ambient air. (a) Concentration time series and MLO-SPO difference, (b) growth rates, (c) 14C and13C isotopes, and (d) O2/N2 ratio. The data for Mauna Loa Observatory (MLO) and South Pole Observatory (SPO) are taken from the Scripps Institution of Oceanography (SIO)/University of California, San Diego (Keeling et al., 2001). The global mean CO2 are taken from National Oceanic and Atmospheric Administration (NOAA) cooperative network (as in Chapter 2), and Greenhouse Gases Observing Satellite (GOSAT) monthly mean XCO2 (mixing ratio) time series are taken from National Institute for Environmental Studies (Yoshida et al., 2013). CO2 growth rates are calculated as the time derivative of deseasonalized time series (Nakazawa et al., 1997). The D(O2/N2) are expressed in per meg units (= (FF/M) × 106, where FF = moles of O2 consumed by fossil-fuel burning, M = 3.706 × 10¹⁹, total number of O2 molecules in the atmosphere (Keeling and Manning, 2014). The14CO2 time series at Barring Head, Wellington, New Zealand (BHD) is taken from GNS Science and NIWA (Turnbull et al., 2017). The multivariate ENSO index (MEI) is shown as the shaded background in panel (b); (warmer shade indicates El Niño). Further details on data sources and processing are available in the chapter data table (Table 5.SM.6).