Back chapter figures
Figure 6.20
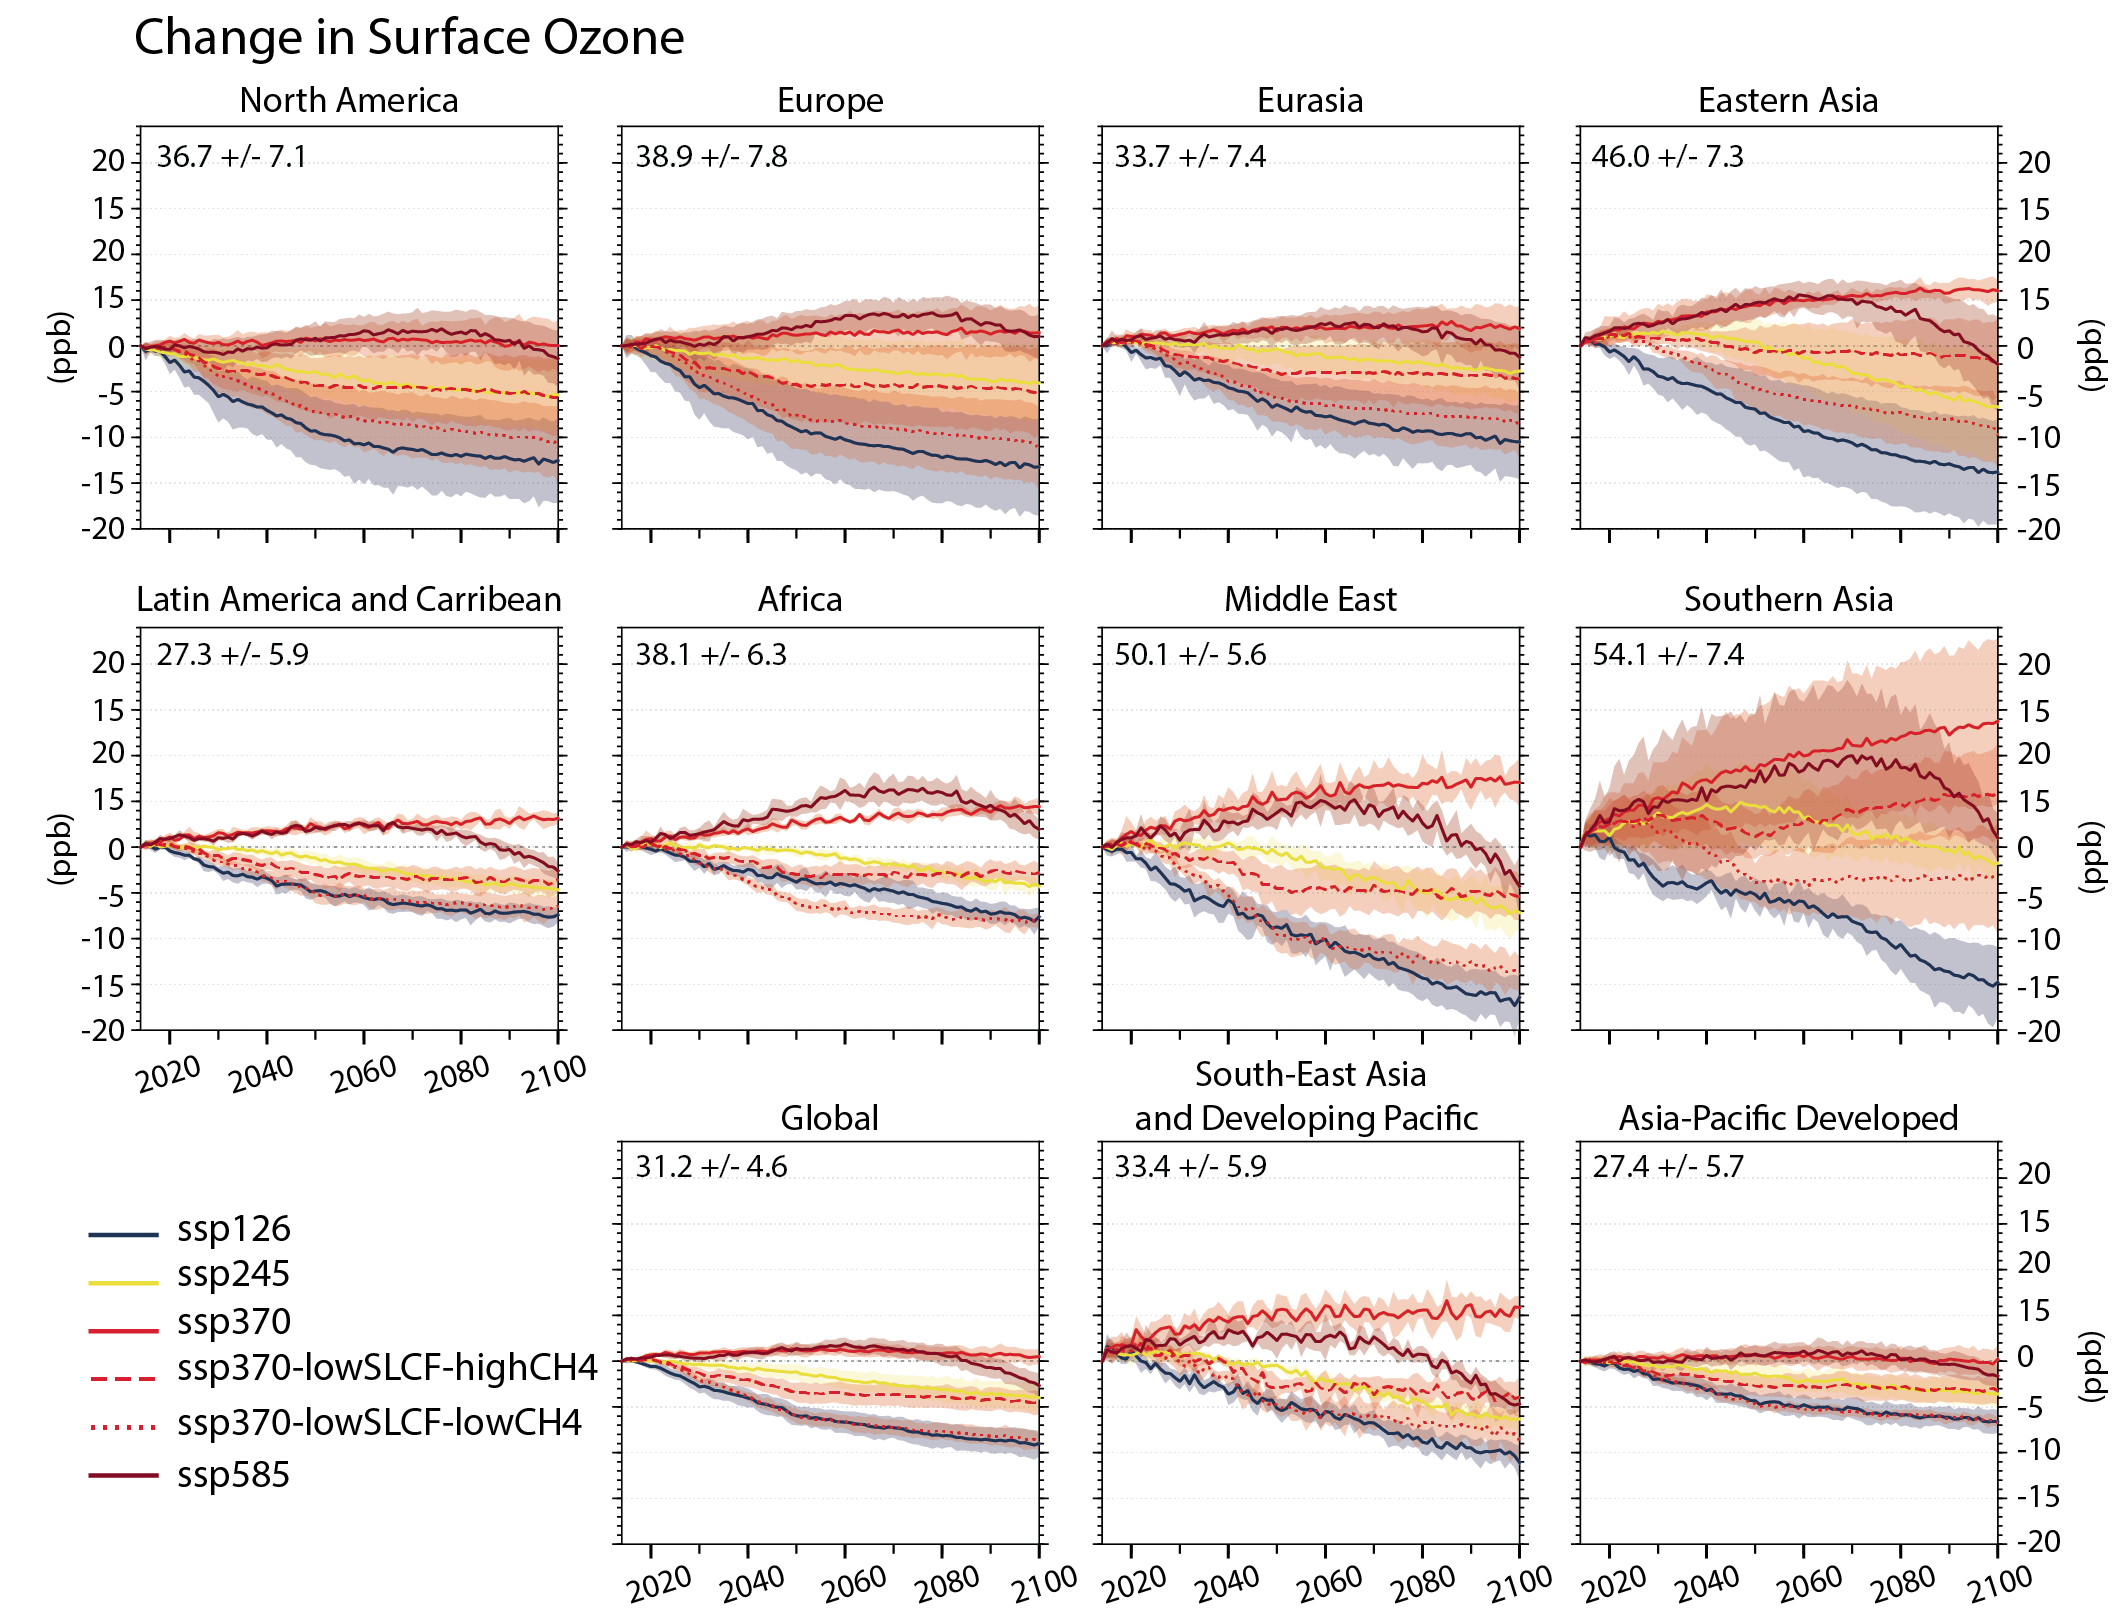
Figure caption
Figure 6.20 | Projected changes in regional annual mean surface ozone (O3; ppb) from 2015 to 2100 in different shared socio-economic pathways (SSPs). Each panel represents values averaged over the corresponding land area (except for ‘Global’) shown on the map in Figure 6.7. Solid coloured lines and shading indicate the multi-model mean and ±1standard deviationacross the available CMIP6 models (Turnock et al. 2020; Allen et al. 2021) for each scenario. Changes are relative to annual mean values calculated over the period 2005–2014 from the historical experiment as indicated in the top left of each regional panel along with ±1 standard deviation. For each model all available ensemble members are averaged before being used to calculate the multi-model mean. Ozone changes are also displayed in the Interactive Atlas. Further details on data sources and processing are available in the chapter data table (Table 6.SM.3).