Back chapter figures
Figure 6.25
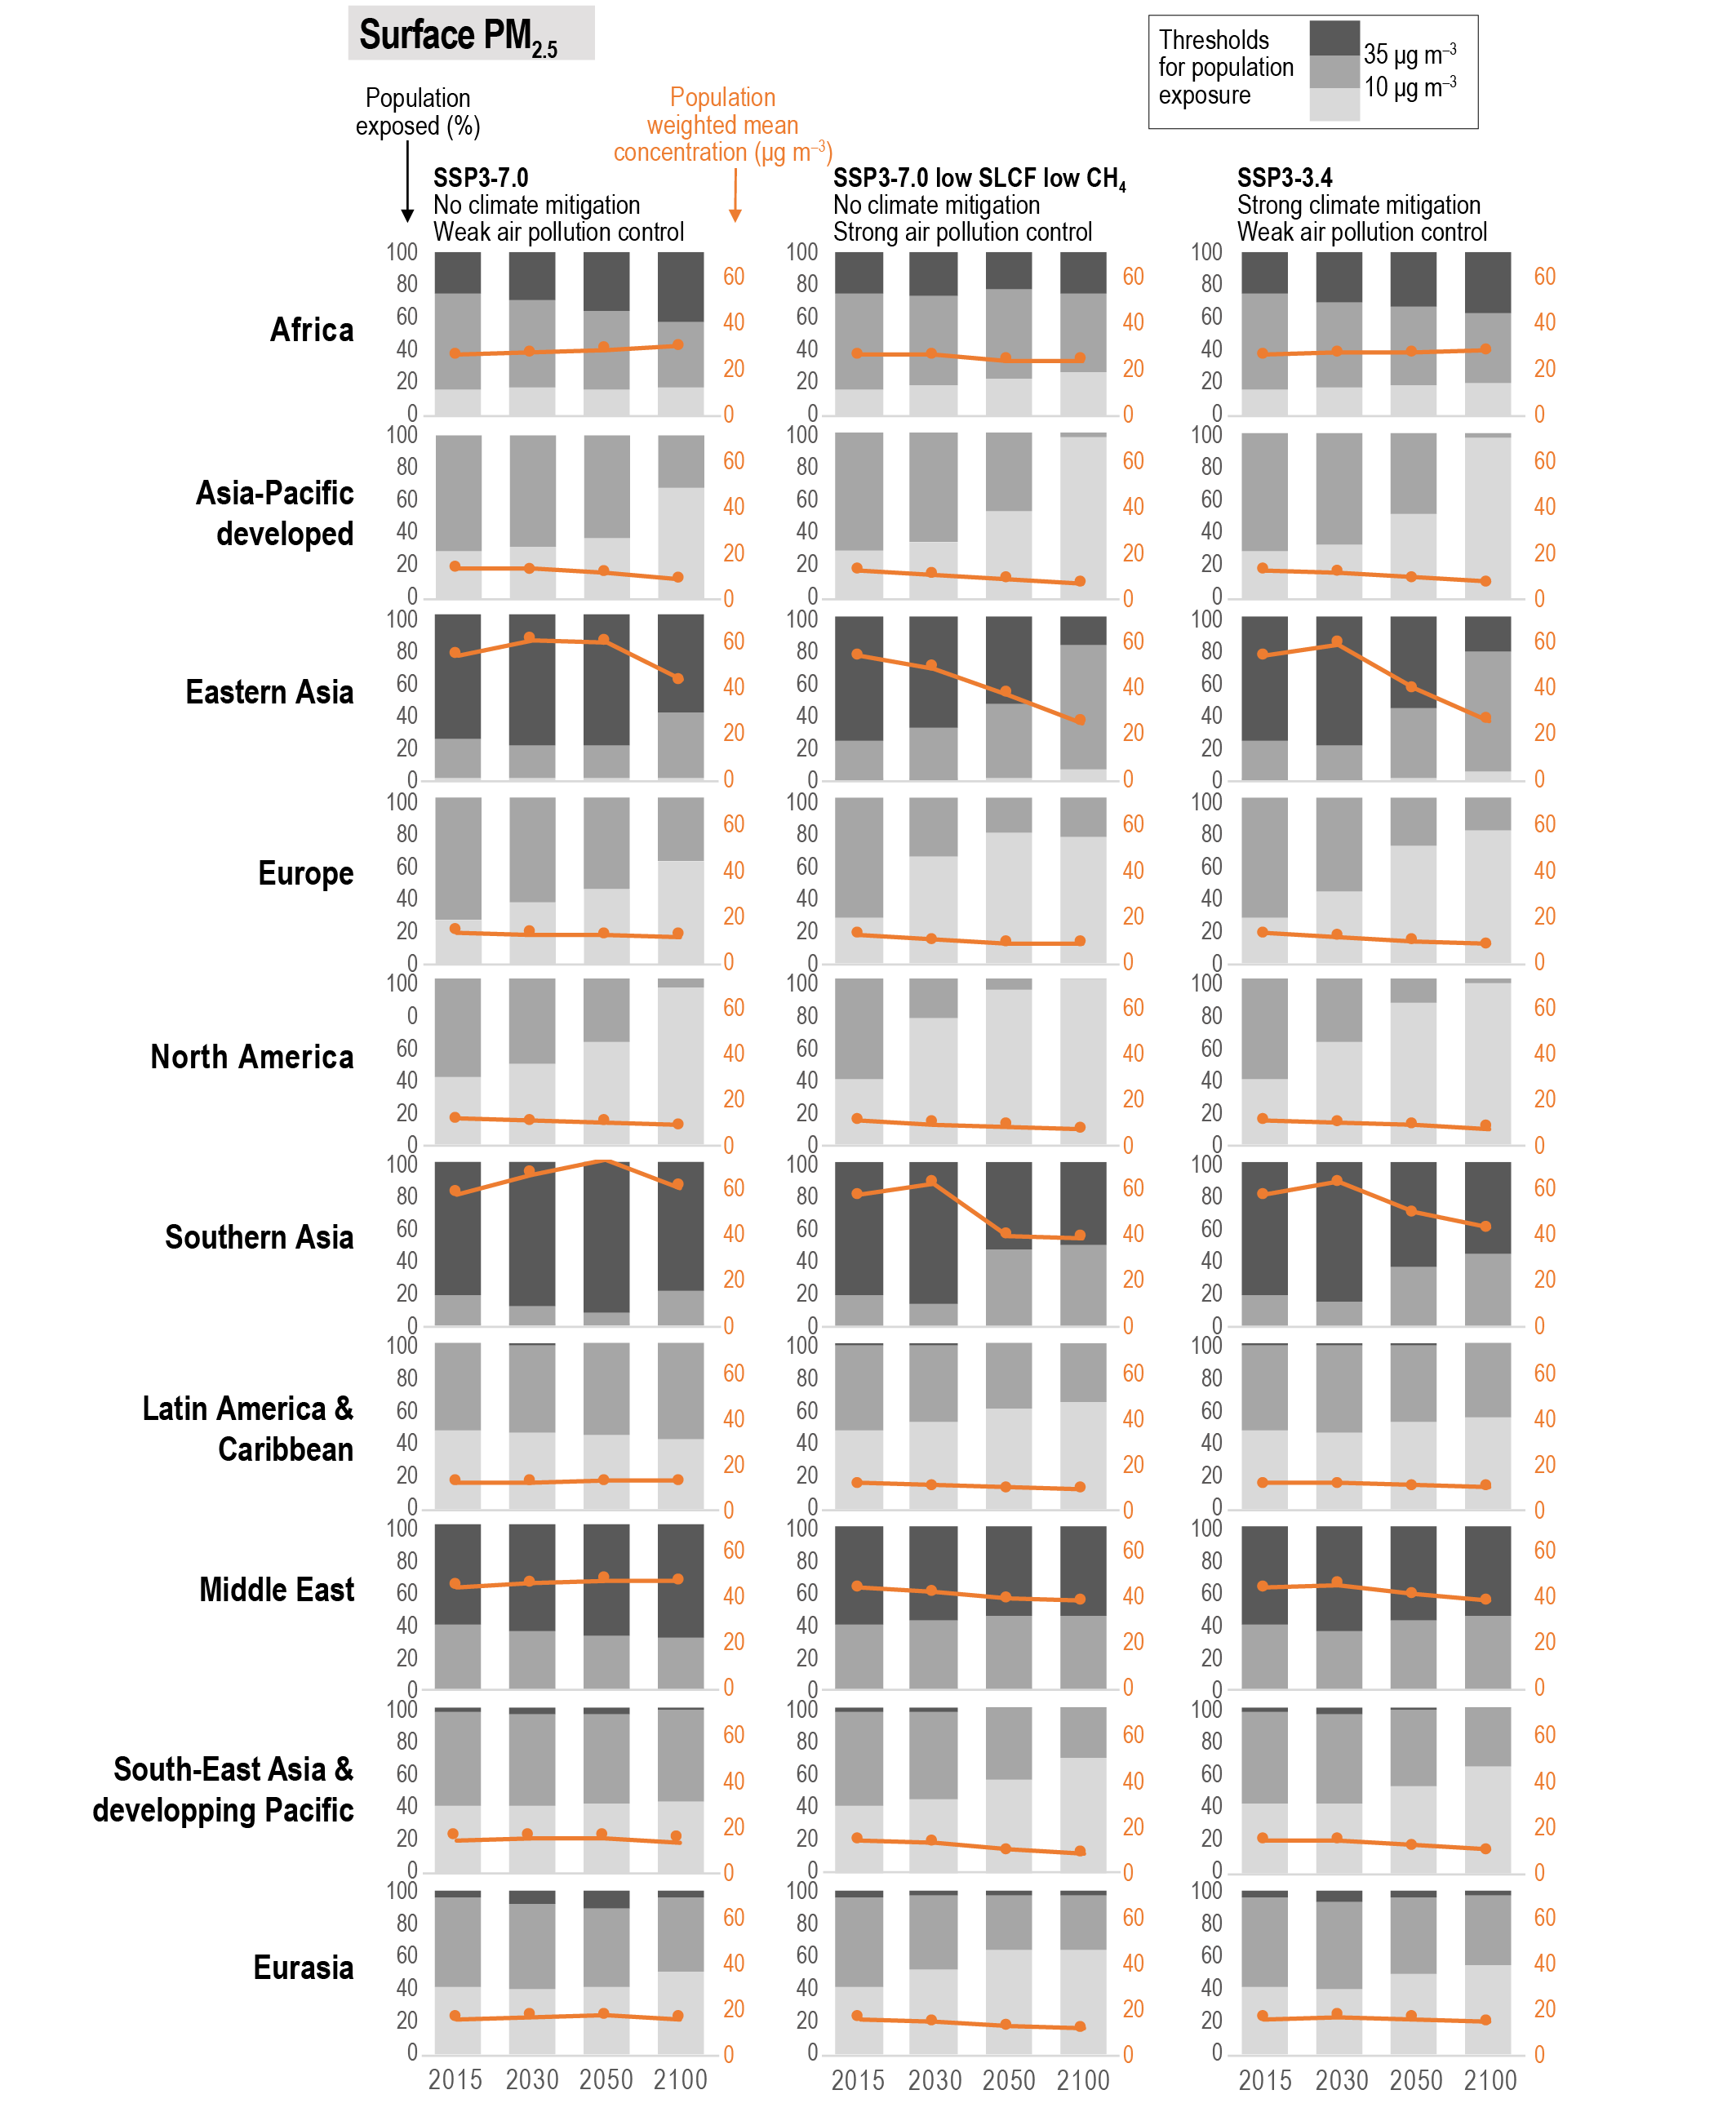
Figure caption
Figure 6.25 | Effect of dedicated air pollution or climate policy on population-weighted PM2.5 concentrations (µg m–3) and share of population (%) exposed to different PM2.5levels across 10 world regions. Thresholds of 10 µg m–3 and 35 µg m–3represent the WHO air quality guideline and the WHO interim target 1, respectively; WHO (2017). Results are compared for SSP3-7.0 (no major improvement of current legislation is assumed), SSP3-lowSLCF (strong air pollution controls are assumed), and a climate change mitigation scenario SSP3-3.4; details of scenario assumptions are discussed in Riahi et al. (2017) and Rao et al. (2017). Analysis performed with the TM5-FASST model (Van Dingenen et al., 2018) using emissions projections from the Shared economic Pathway (SSP) database (Riahi et al., 2017; Rogelj et al., 2018a; Gidden et al., 2019). Further details on data sources and processing are available in the chapter data table (Table 6.SM.3).