Back chapter figures
Figure 6.5
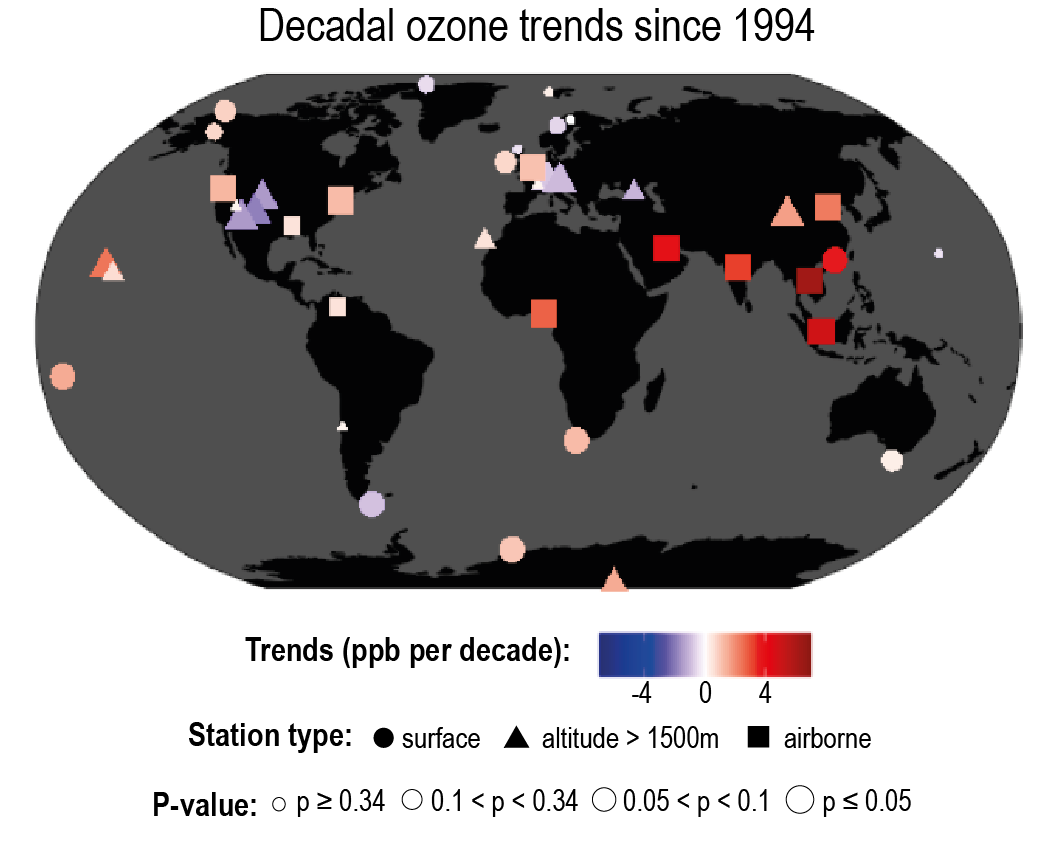
Figure caption
Figure 6.5 | Decadal tropospheric ozone trendssince 1994. Trends are shown at 28 remote and regionally representative surface sites (Cooper et al., 2020) and in 11 regions of the lower free troposphere (650 hPa, about 3.5 km) as measured by In-Service Aircraft for a Global Observing System (IAGOS) above Europe, north-eastern USA, south-eastern USA, western North America, north-east China, South East Asia, southern India, the Persian Gulf, Malaysia/Indonesia, the Gulf of Guinea and northern South America (Gaudel et al., 2020). High-elevation surface sites are >1500 m above sea level. All trends end with the most recently available year but begin in 1995 or 1994. The sites and datasets are the same as those used in Figure 2.8, further details on data sources and processing are available in the Chapter 2 data table (Table 2.SM.1).