Back chapter figures
Figure 6.9
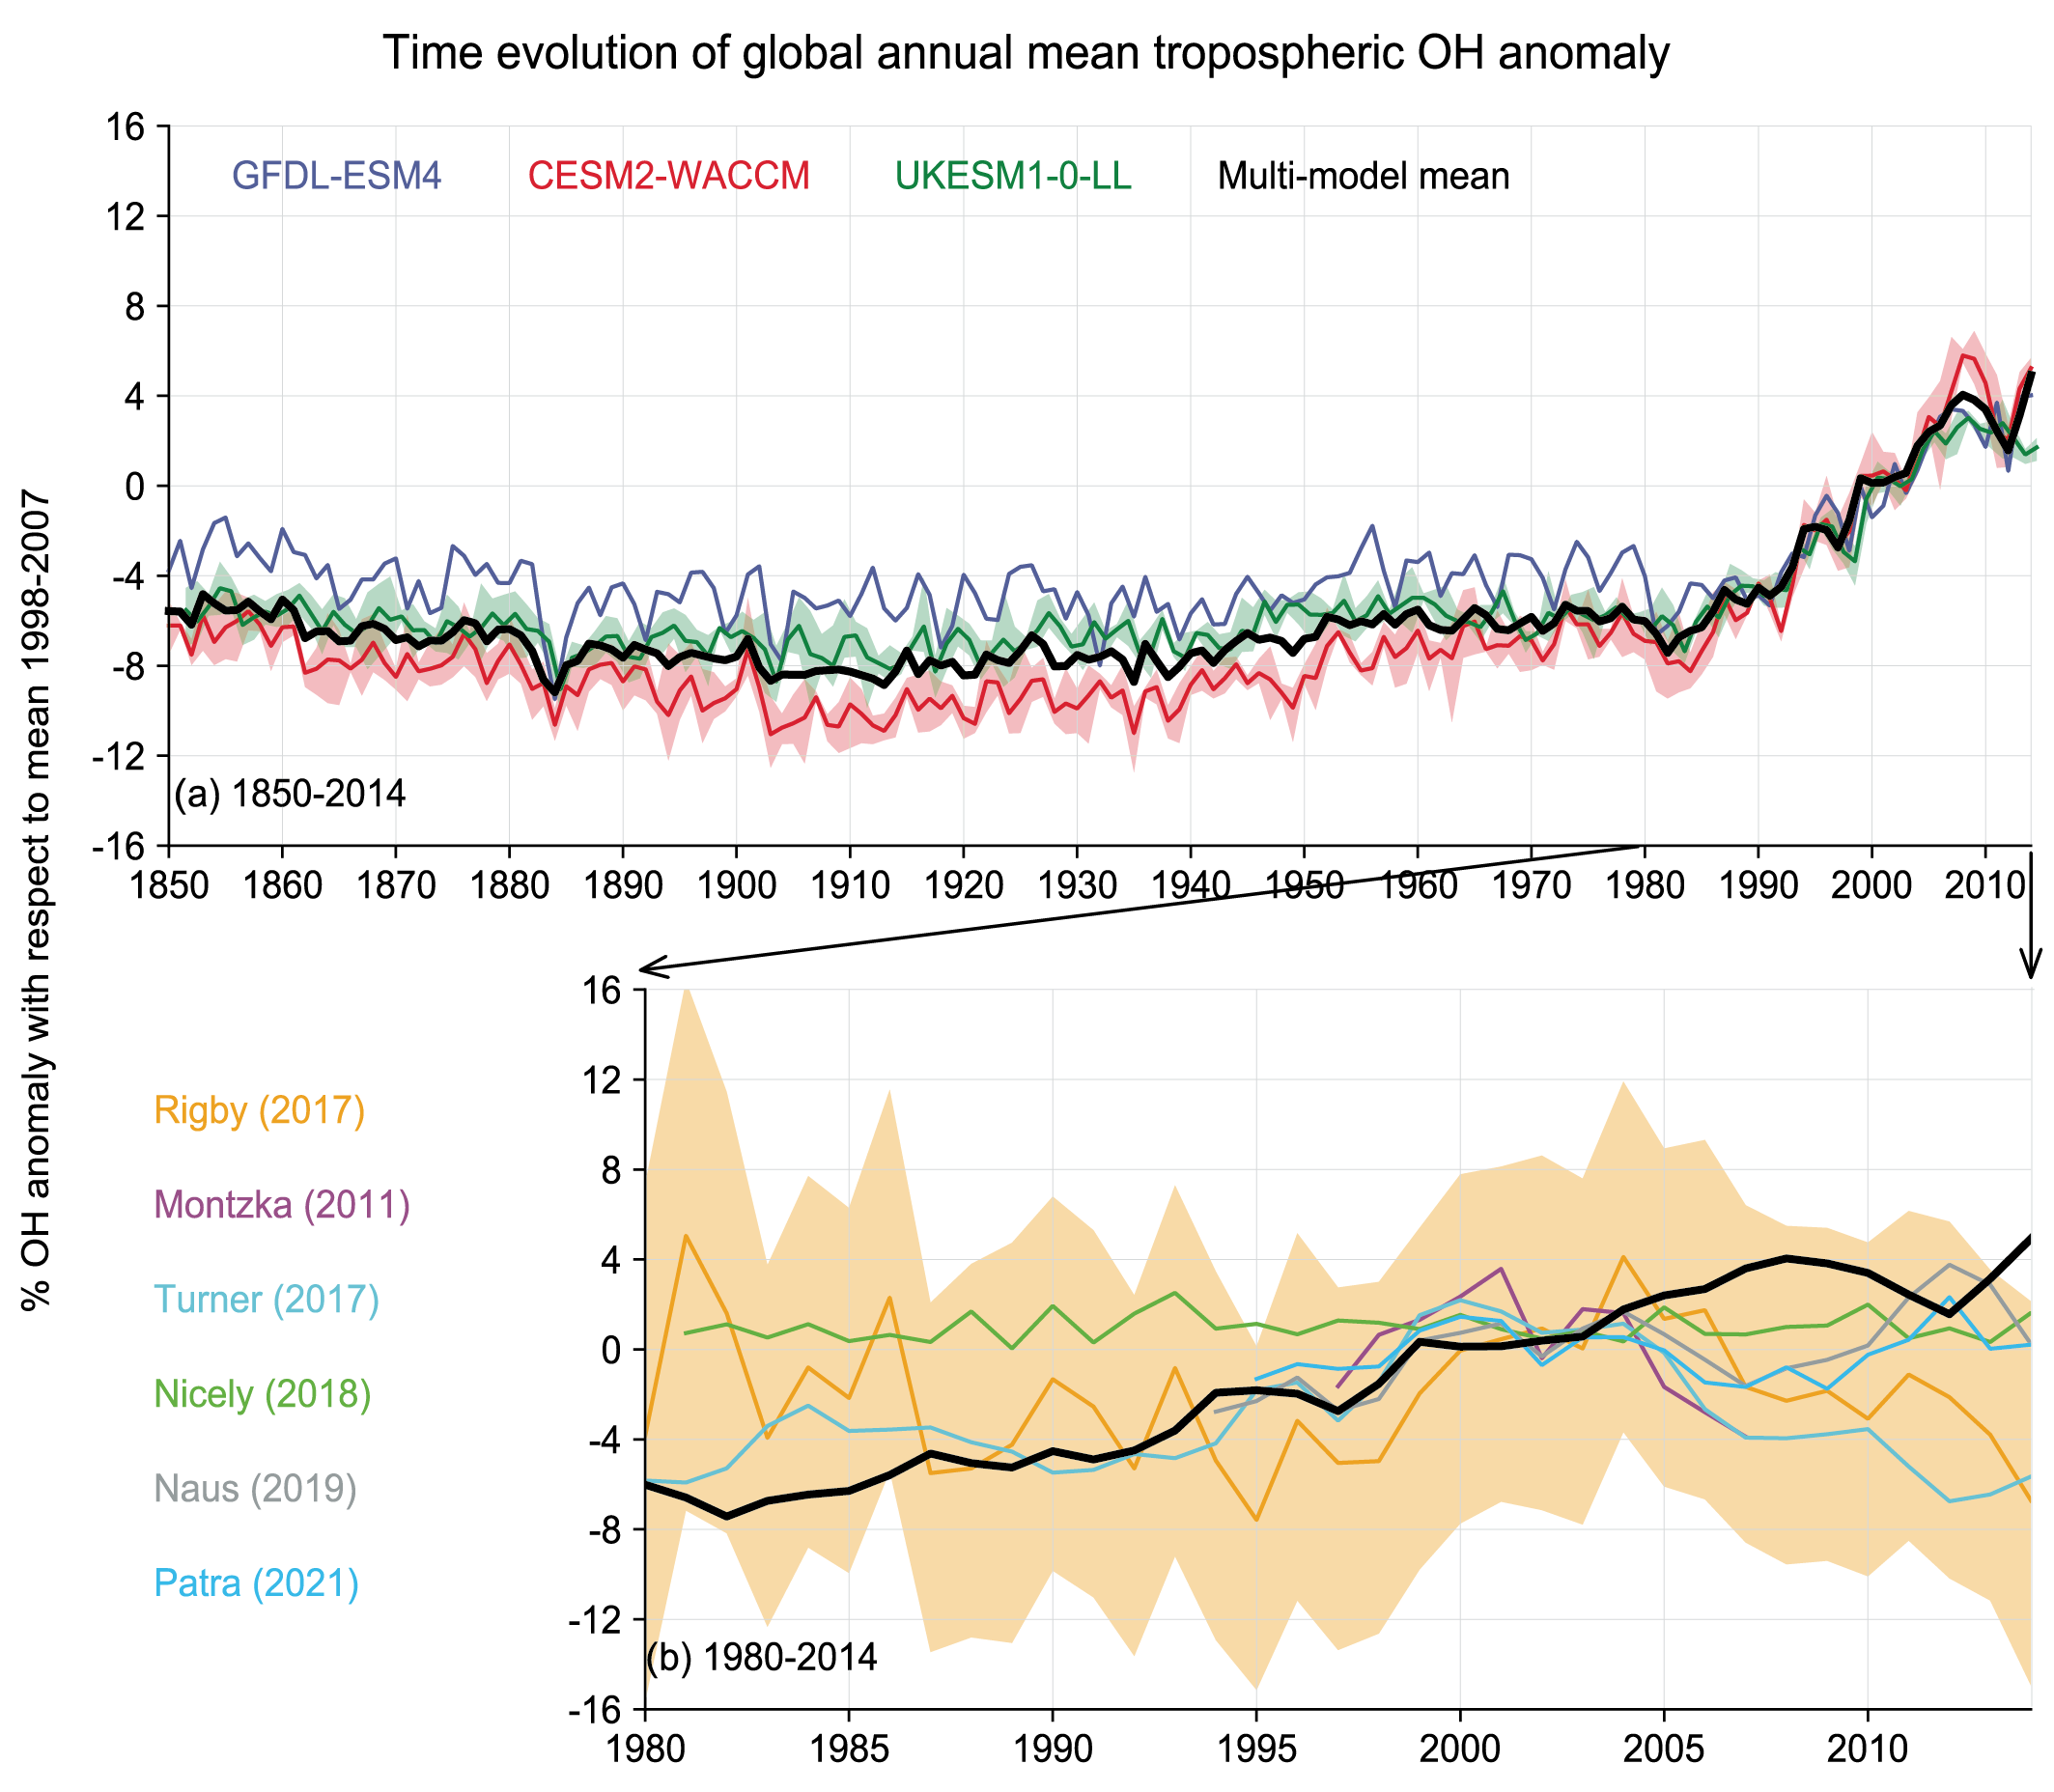
Figure caption
Figure 6.9 | Time evolution of global annual mean tropospheric hydroxyl (OH) over the historical period, expressed as a percentage anomaly relative to the mean over 1998–2007. (a) Results from three CMIP6 models, including UKESM1-0LL (green), GFDL-ESM4 (blue), and CESM2-WACCM (red), are shown; the shaded light green and light red bands show mean over multiple ensemble members for UKESM1-0LL (3) and CESM2-WACCM (3) models, respectively with the multi-model mean anomalies shown in thick black line. (b) Multi-model mean OH anomalies for the 1980–2014 period compared with those derived from observational-based inversions from Montzka et al., (2011); Rigby et al., (2017); Turner et al., (2017); Nicely et al., (2018); Naus et al., (2019); Patra et al., (2021) in the zoomed box. Further details on data sources and processing are available in the chapter data table (Table 6.SM.3).