Back chapter figures
Figure 7.16
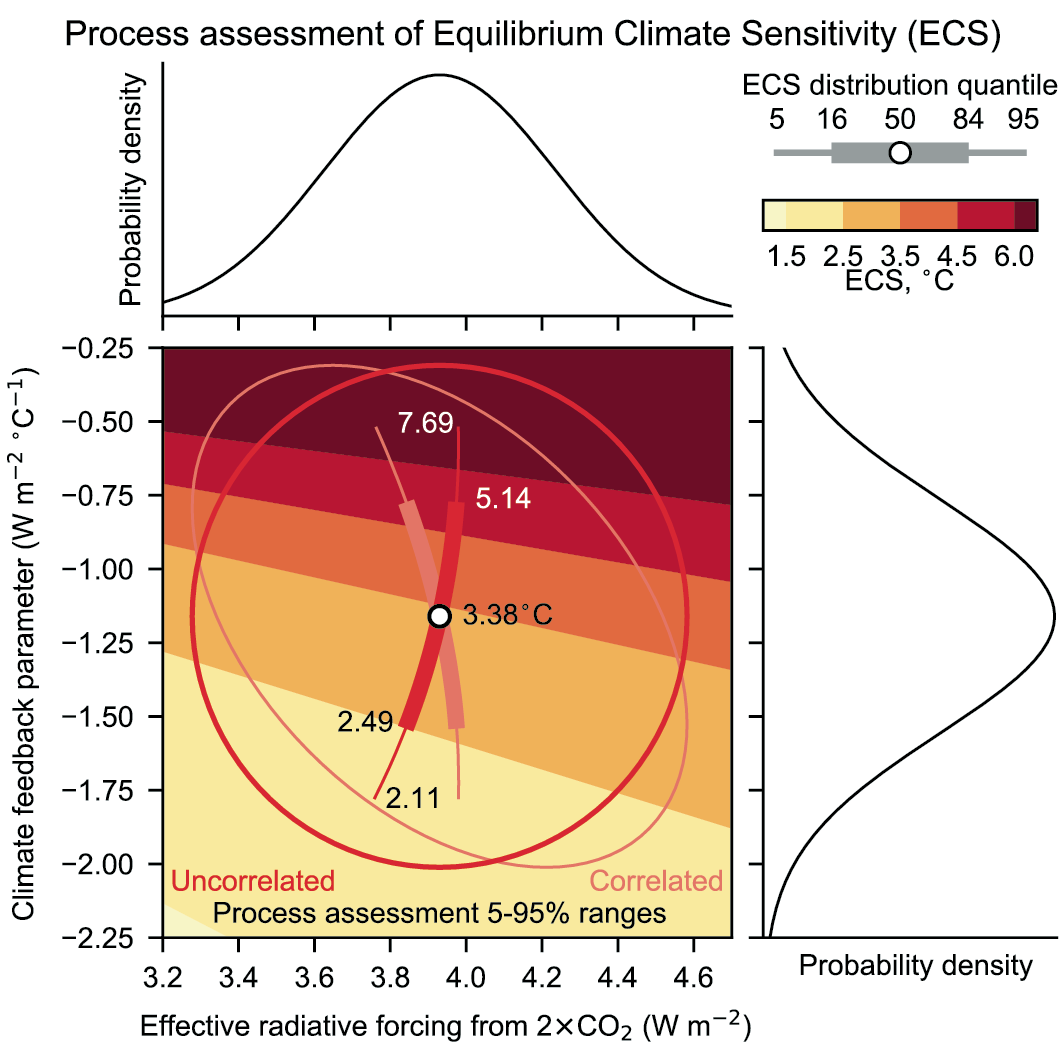
Figure caption
Figure 7.16 | Probability distributions of ERF to CO2doubling (ΔF2×CO2; top) and the net climate feedback ( α ; right), derived from process-based assessments in Sections 7.3.2 and 7.4.2. Central panel shows the joint probability density function calculated on a two-dimensional plane ofΔF2×CO2 and α (red), on which the 90% range shown by an ellipse is imposed to the background theoretical values of ECS (colour shading). The white dot, and thick and thin curves inside the ellipse represent the mean, likely and very likely ranges of ECS. An alternative estimation of the ECS range (pink) is calculated by assuming thatΔF2×CO2 and α have a covariance. The assumption about the co-dependence betweenΔF2×CO2 and α does not alter the mean estimate of ECS but affects its uncertainty. Further details on data sources and processing are available in the chapter data table (Table 7.SM.14).