Box 8.2, Figure 1
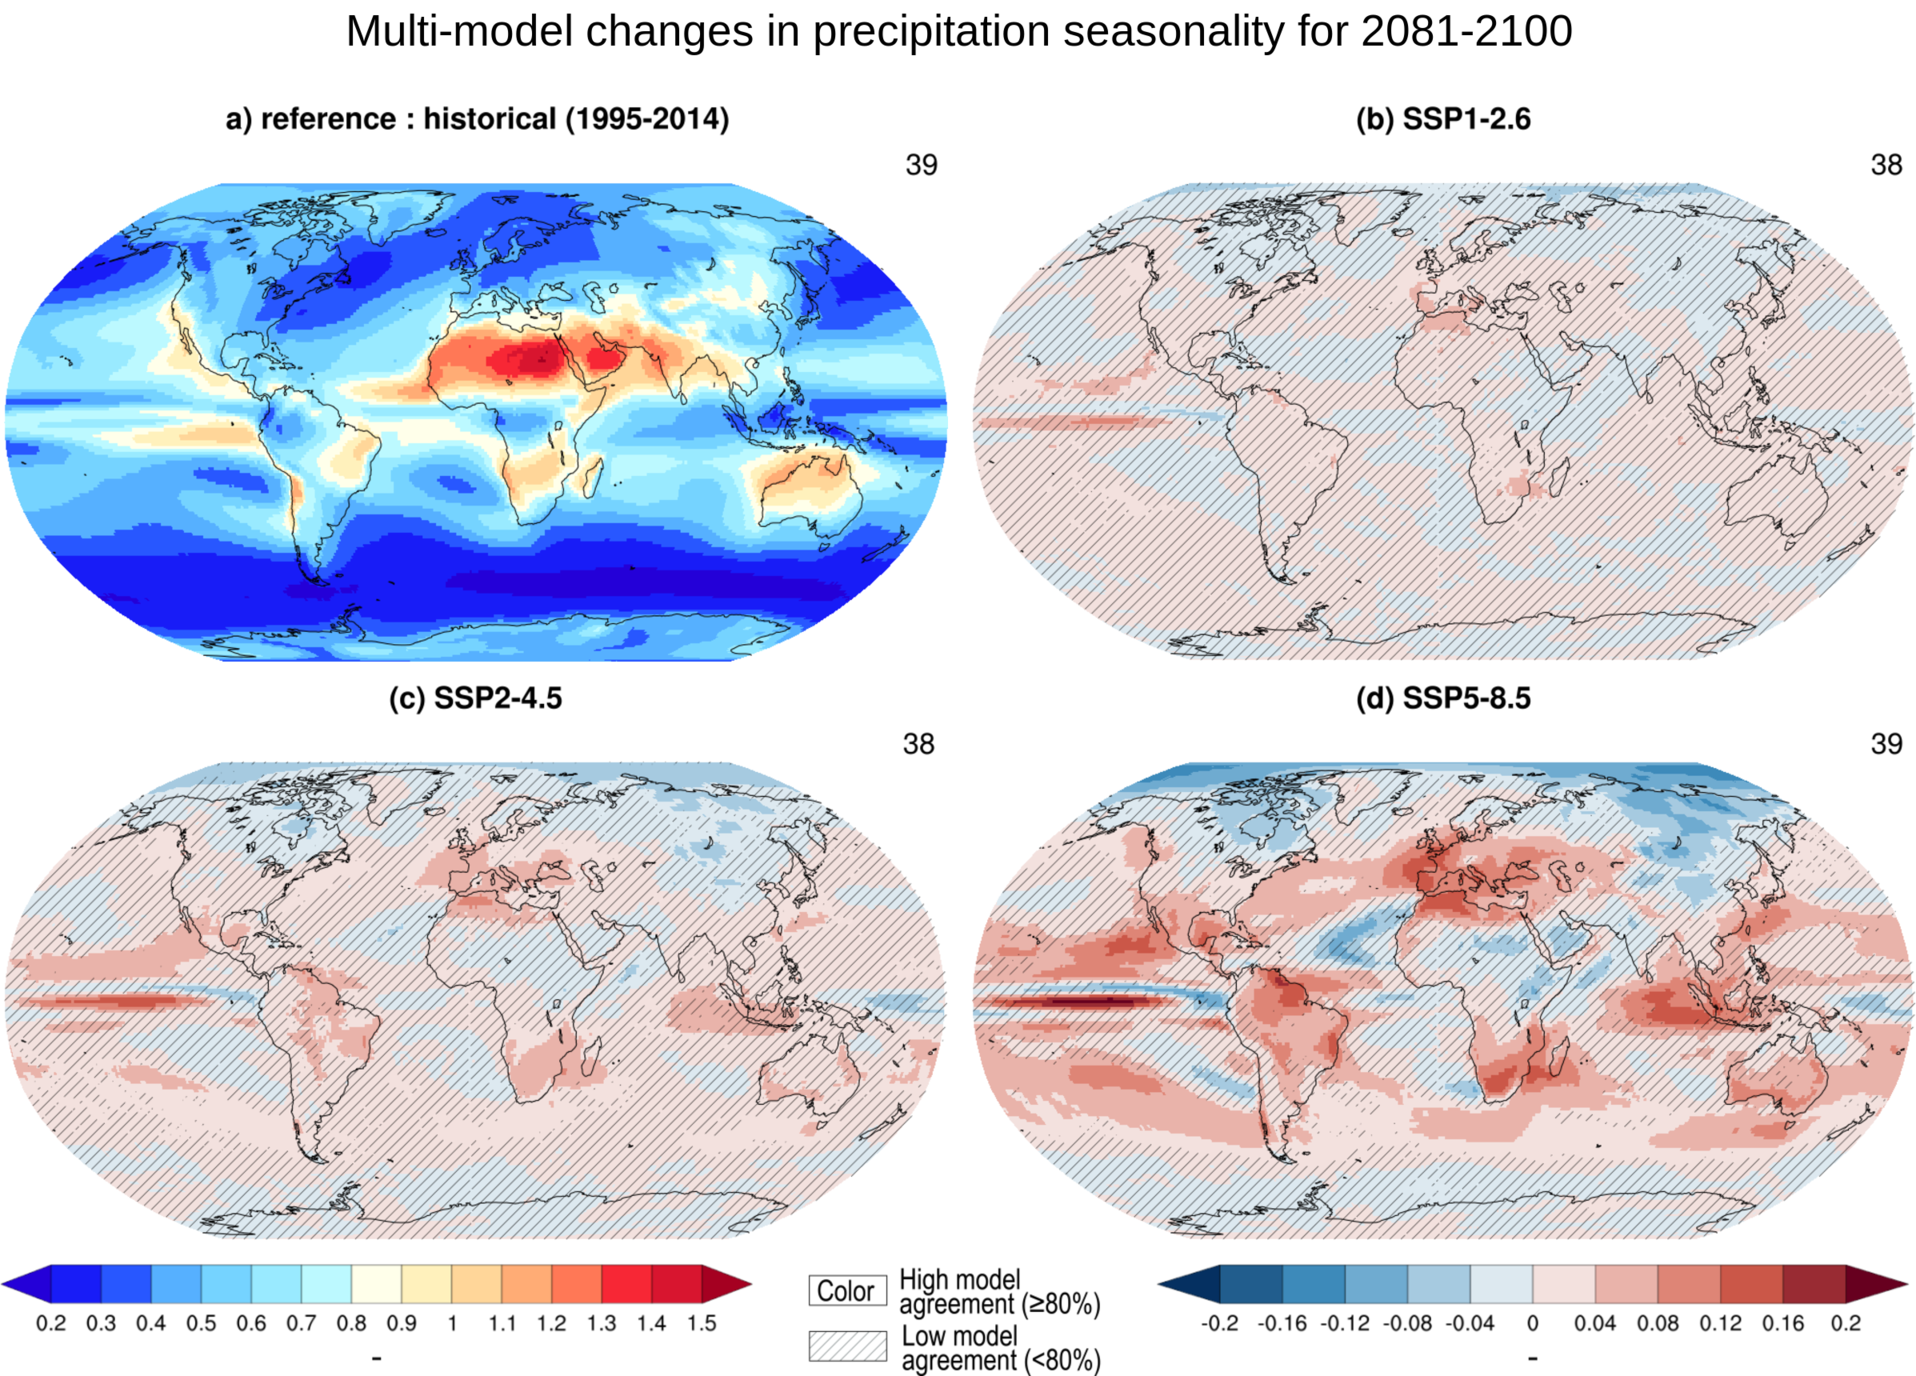
Figure caption
Box 8.2, Figure 1 | Projected long-term changes in precipitation seasonality. Global maps of projected changes in precipitation seasonality (simply defined as the sum of the absolute deviations of mean monthly rainfalls from the overall monthly mean, divided by the mean annual rainfall as in Walsh and Lawler, 1981) averaged across available CMIP6 models (number provided at the top right of each panel) in the SSP1-2.6 (b), SSP2-4.5 (c) and SSP5-8.5 (d) scenario respectively. The simulated 1995–2014 climatology is shown in panel (a). All changes are estimated in 2081–2100 relative to 1995–2014. Uncertainty is represented using the simple approach. No overlay indicates regions with high model agreement, where ≥80% of models agree on sign of change. Diagonal lines indicate regions with low model agreement, where <80% of models agree on sign of change. For more information on the simple approach, please refer to the Cross-Chapter Box Atlas.1. Further details on data sources and processing are available in the chapter data table (Table 8.SM.1).