Back chapter figures
Figure 8.11
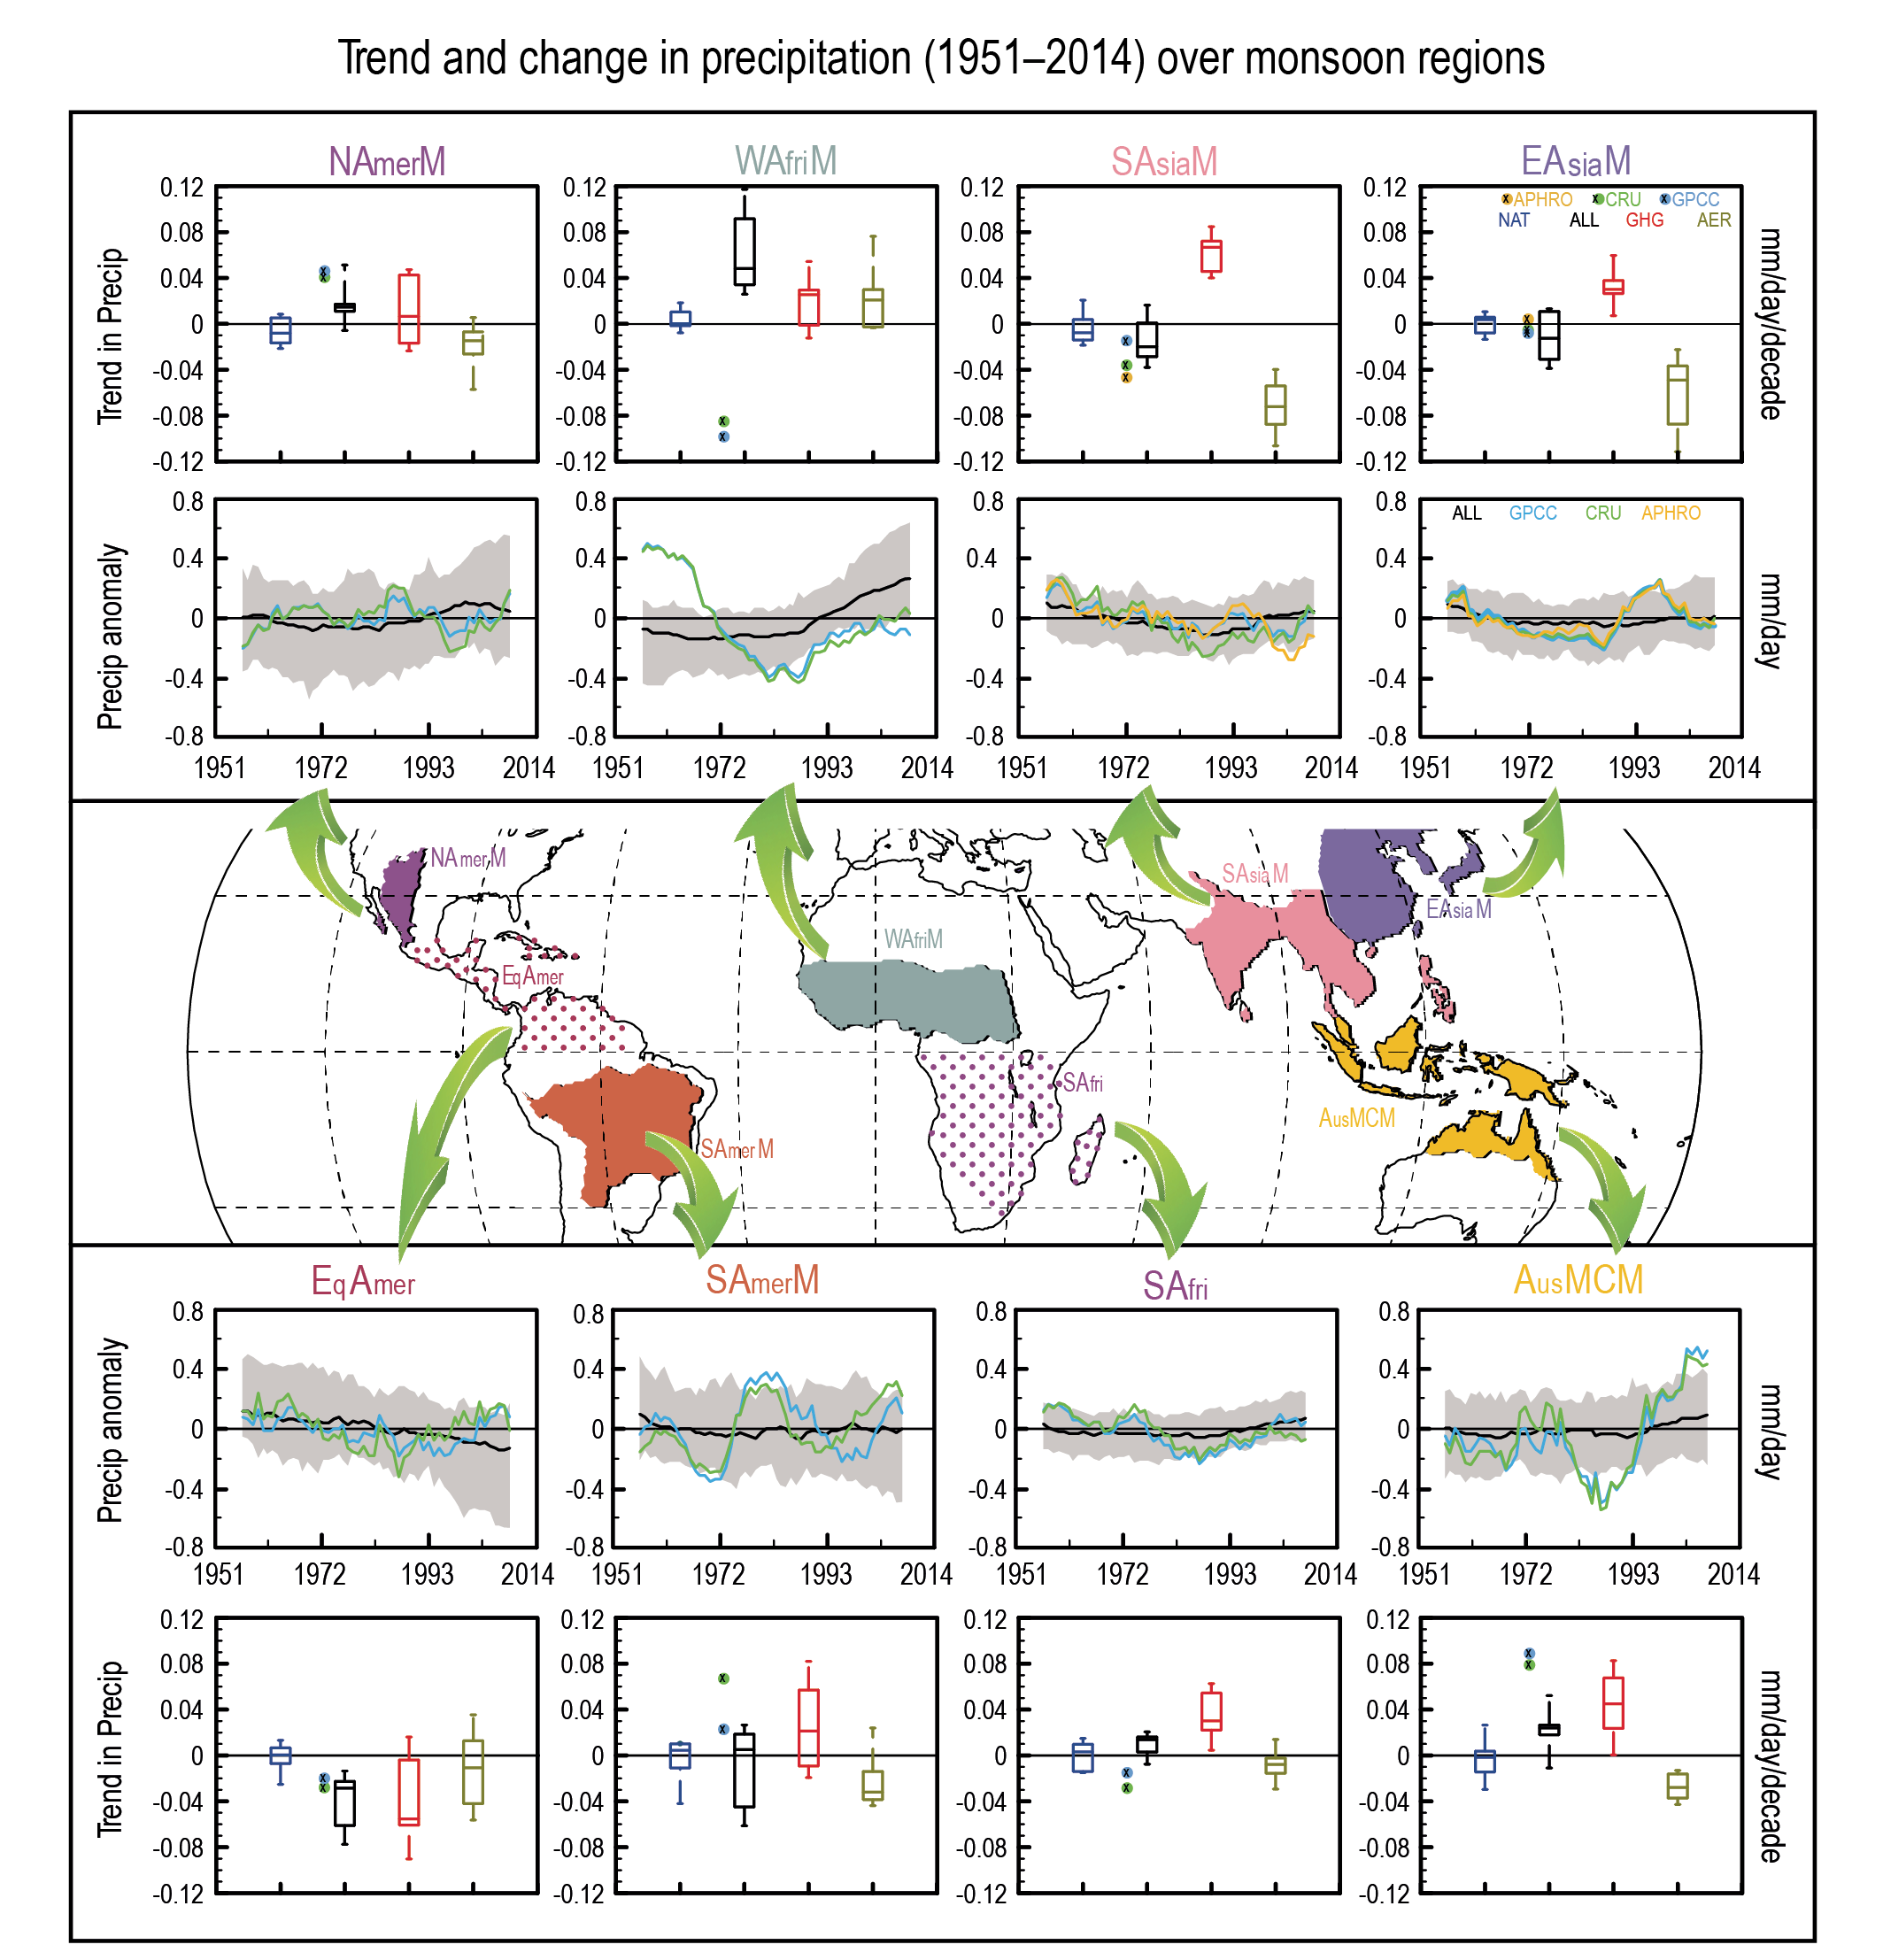
Figure caption
Figure 8.11 | Regional monsoon precipitation changes from observations and model attribution. Precipitation changes during 1951–2014 are shown as least-square linear trends in box-whisker plots (first and fourth rows) over the six regional monsoons, for example, North American monsoon (NAmerM, July–August–September, JAS), West African monsoon (WAfriM, June–July–August–September, JJAS), South and South East Asian monsoon (SAsiaM, June–July–August–September, JJAS), East Asian monsoon (EAsiaM, June–July–August), South American monsoon (SAmerM, December–January–February, DJF), Australian and Maritime Continent monsoon (AusMCM, December–January–February, DJF), and over the two land domains, for example, equatorial America (EqAmer, June–July–August, JJA) and South Africa (SAfri, December–January–February, DJF), as identified in the map shown in the middle and as described in Annex V. Precipitation changes are computed from observations and from Detection and Attribution Model Intercomparison Project (DAMIP) CMIP6 experiments over the historical period with all-forcing (ALL), GHG-only forcing (labelled GHG), Aerosol-only (AER) and Natural (NAT) forcings prescribed. Observations are based on the CRU (light green) and GPCC (light blue) datasets and the APHRODITE (light orange) dataset for SAsiaM and EAsiaM. CMIP6 simulations are taken from nine CMIP6 models contributing to DAMIP, with at least three members. Ensembles are weight-averaged for the respective model ensemble size. Observed trends are shown as coloured circles and the simulated trends from the CMIP6 multi-model experiments are shown as box-whisker plots. Precipitation anomaly time-series are shown in the second and third row. The thick black line is the multi-model ensemble-mean precipitation anomaly time-series from the ALL experiment and the grey shading shows the spread across the multi-model ensembles. An 11-year running mean has been applied on the precipitation anomaly time-series prior to calculating the multi-model ensemble mean. Further details on data sources and processing are available in the chapter data table (Table 8.SM.1).