Back chapter figures
Figure 8.12
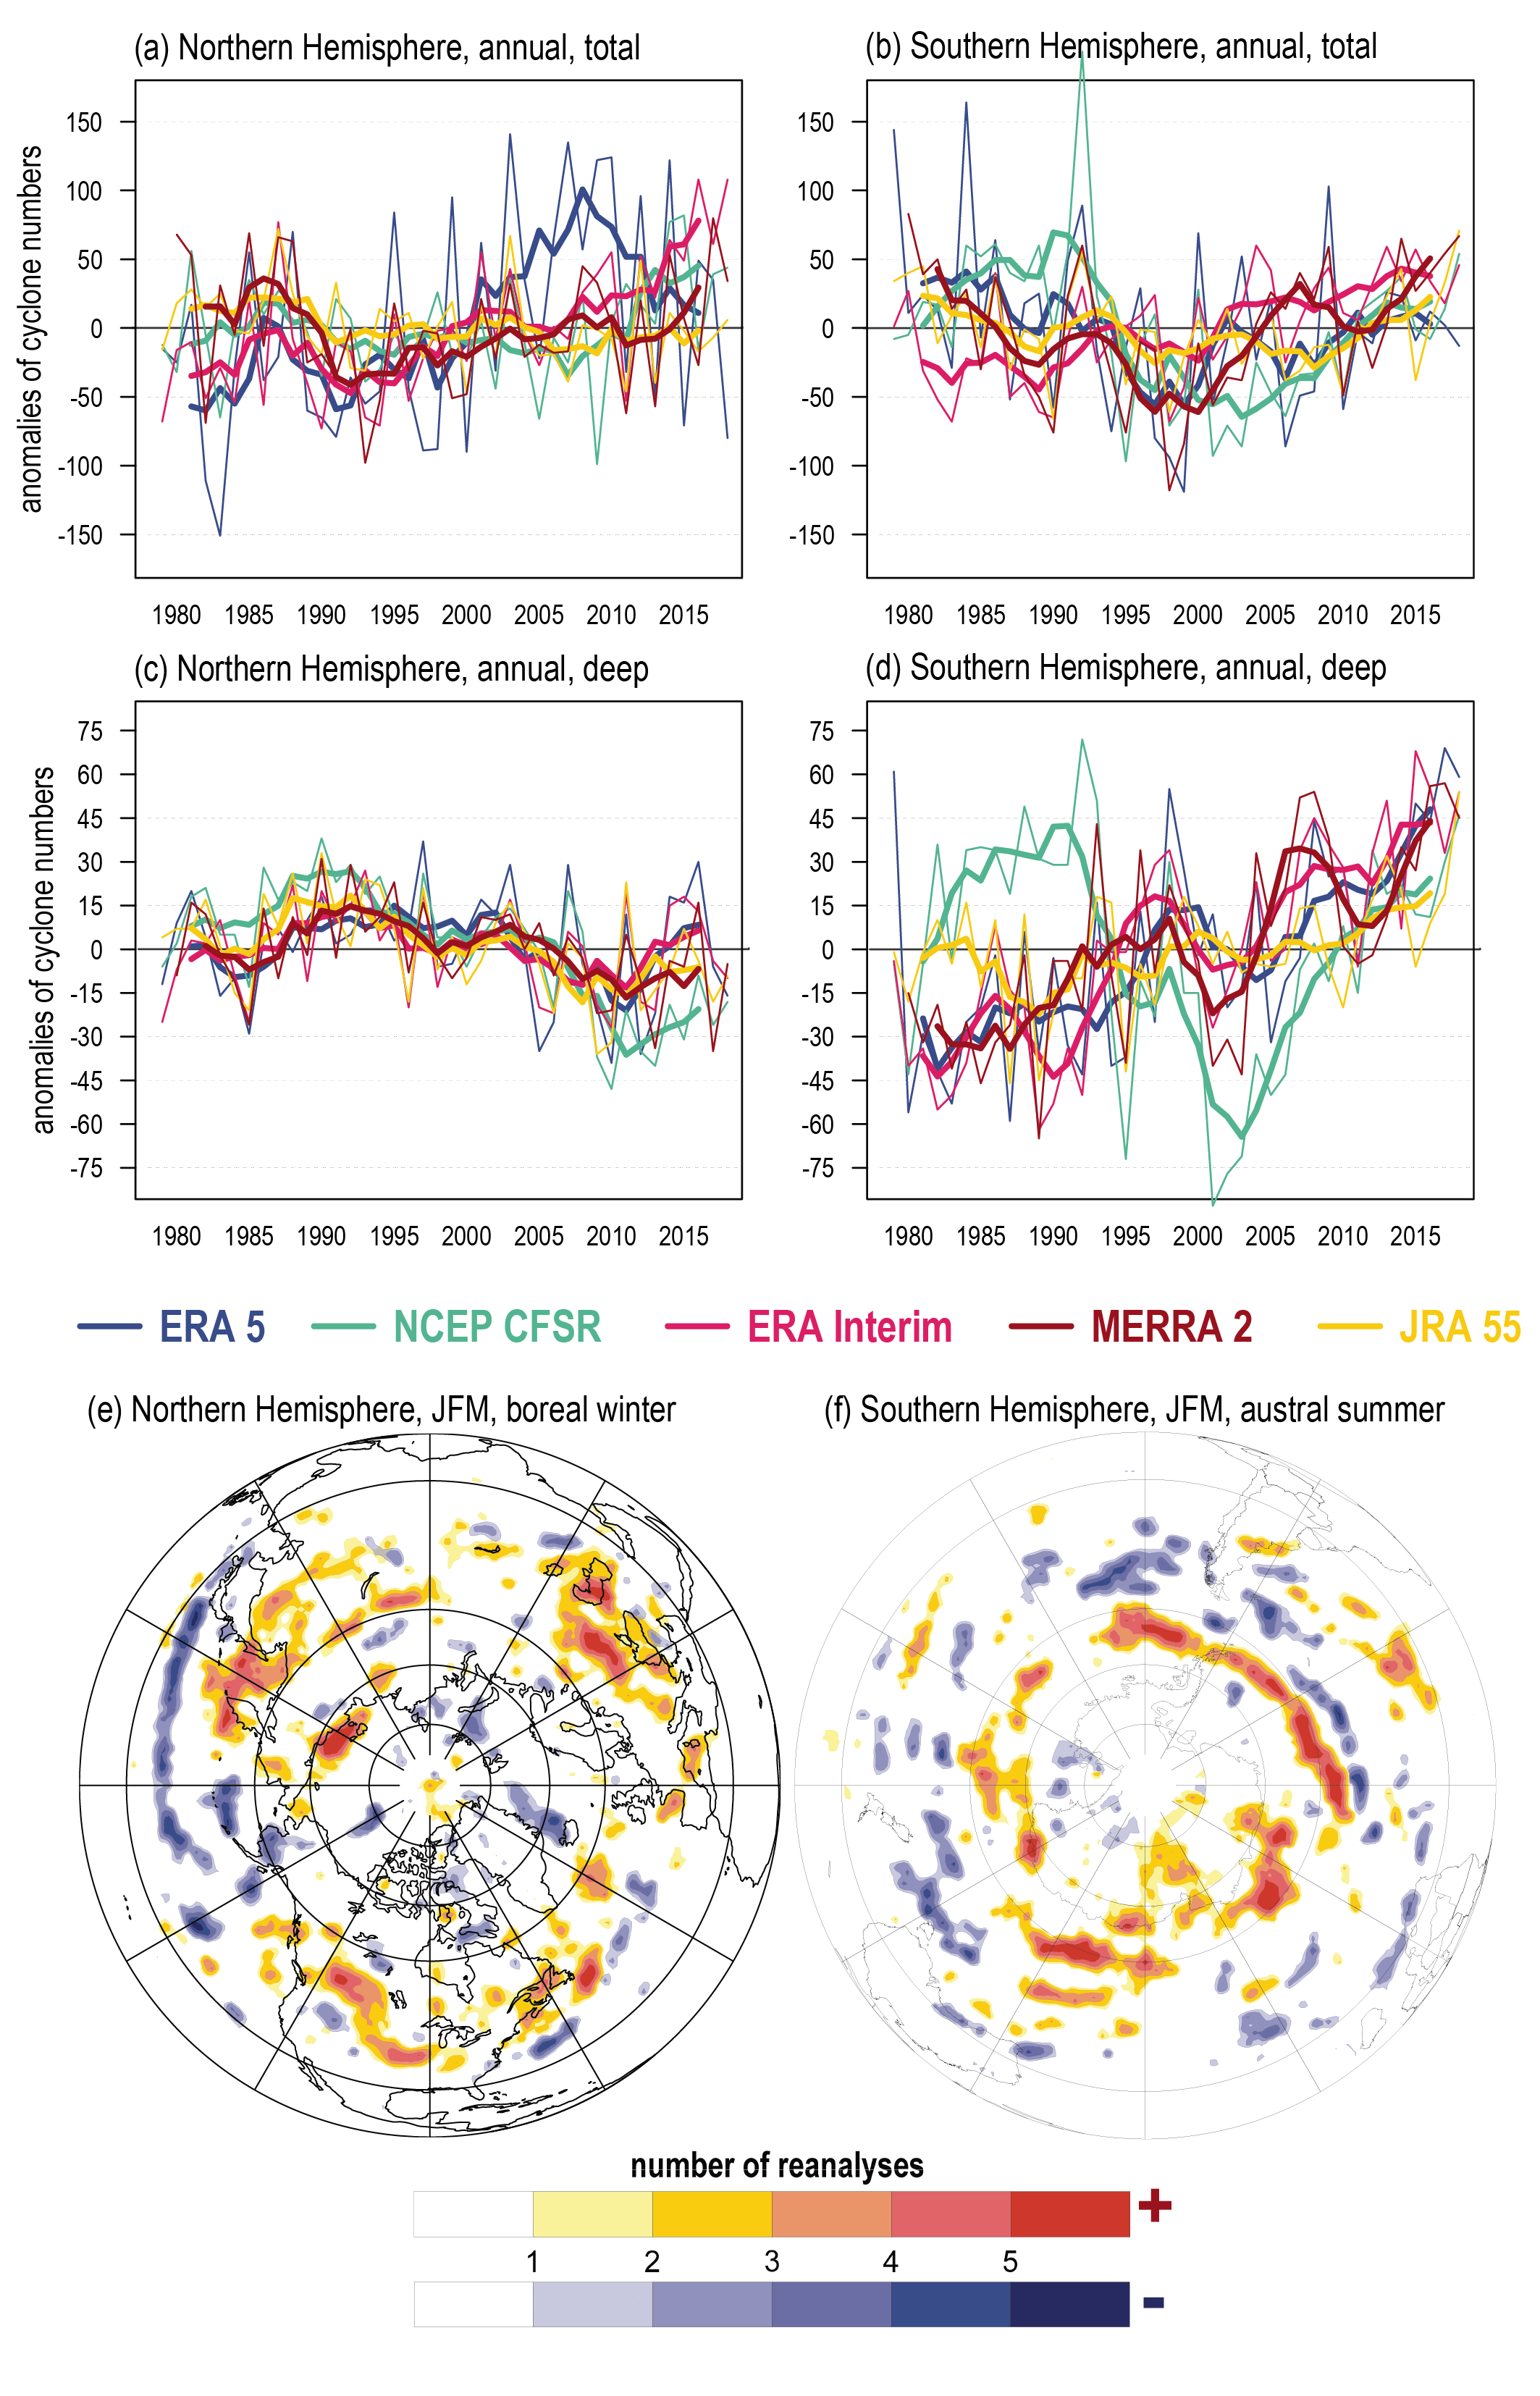
Figure caption
Figure 8.12 | Annual anomalies (with respect to the reference period1979–2018) of the total number of extratropical cyclones (a, b) and of the number of deep cyclones (<980 hPa) (c, d) over the Northern (a, c) and the Southern (b, d) Hemispheres in different reanalyses (shown in colours in the legend).
Note different vertical scales for panels (a, b) and (c, d). Thin lines indicate annual anomalies and bold lines indicate five-year running averages. (e, f) The number of reanalyses (out of five) simultaneously indicating statistically significant (90% level) linear trends of the same sign during 1979–2018 for JFM (January–February–March) over the Northern Hemisphere (e) and over the Southern Hemisphere (f). Updated from Tilinina et al. (2013). Further details on data sources and processing are available in the chapter data table (Table 8.SM.1).