Back chapter figures
Figure 8.16
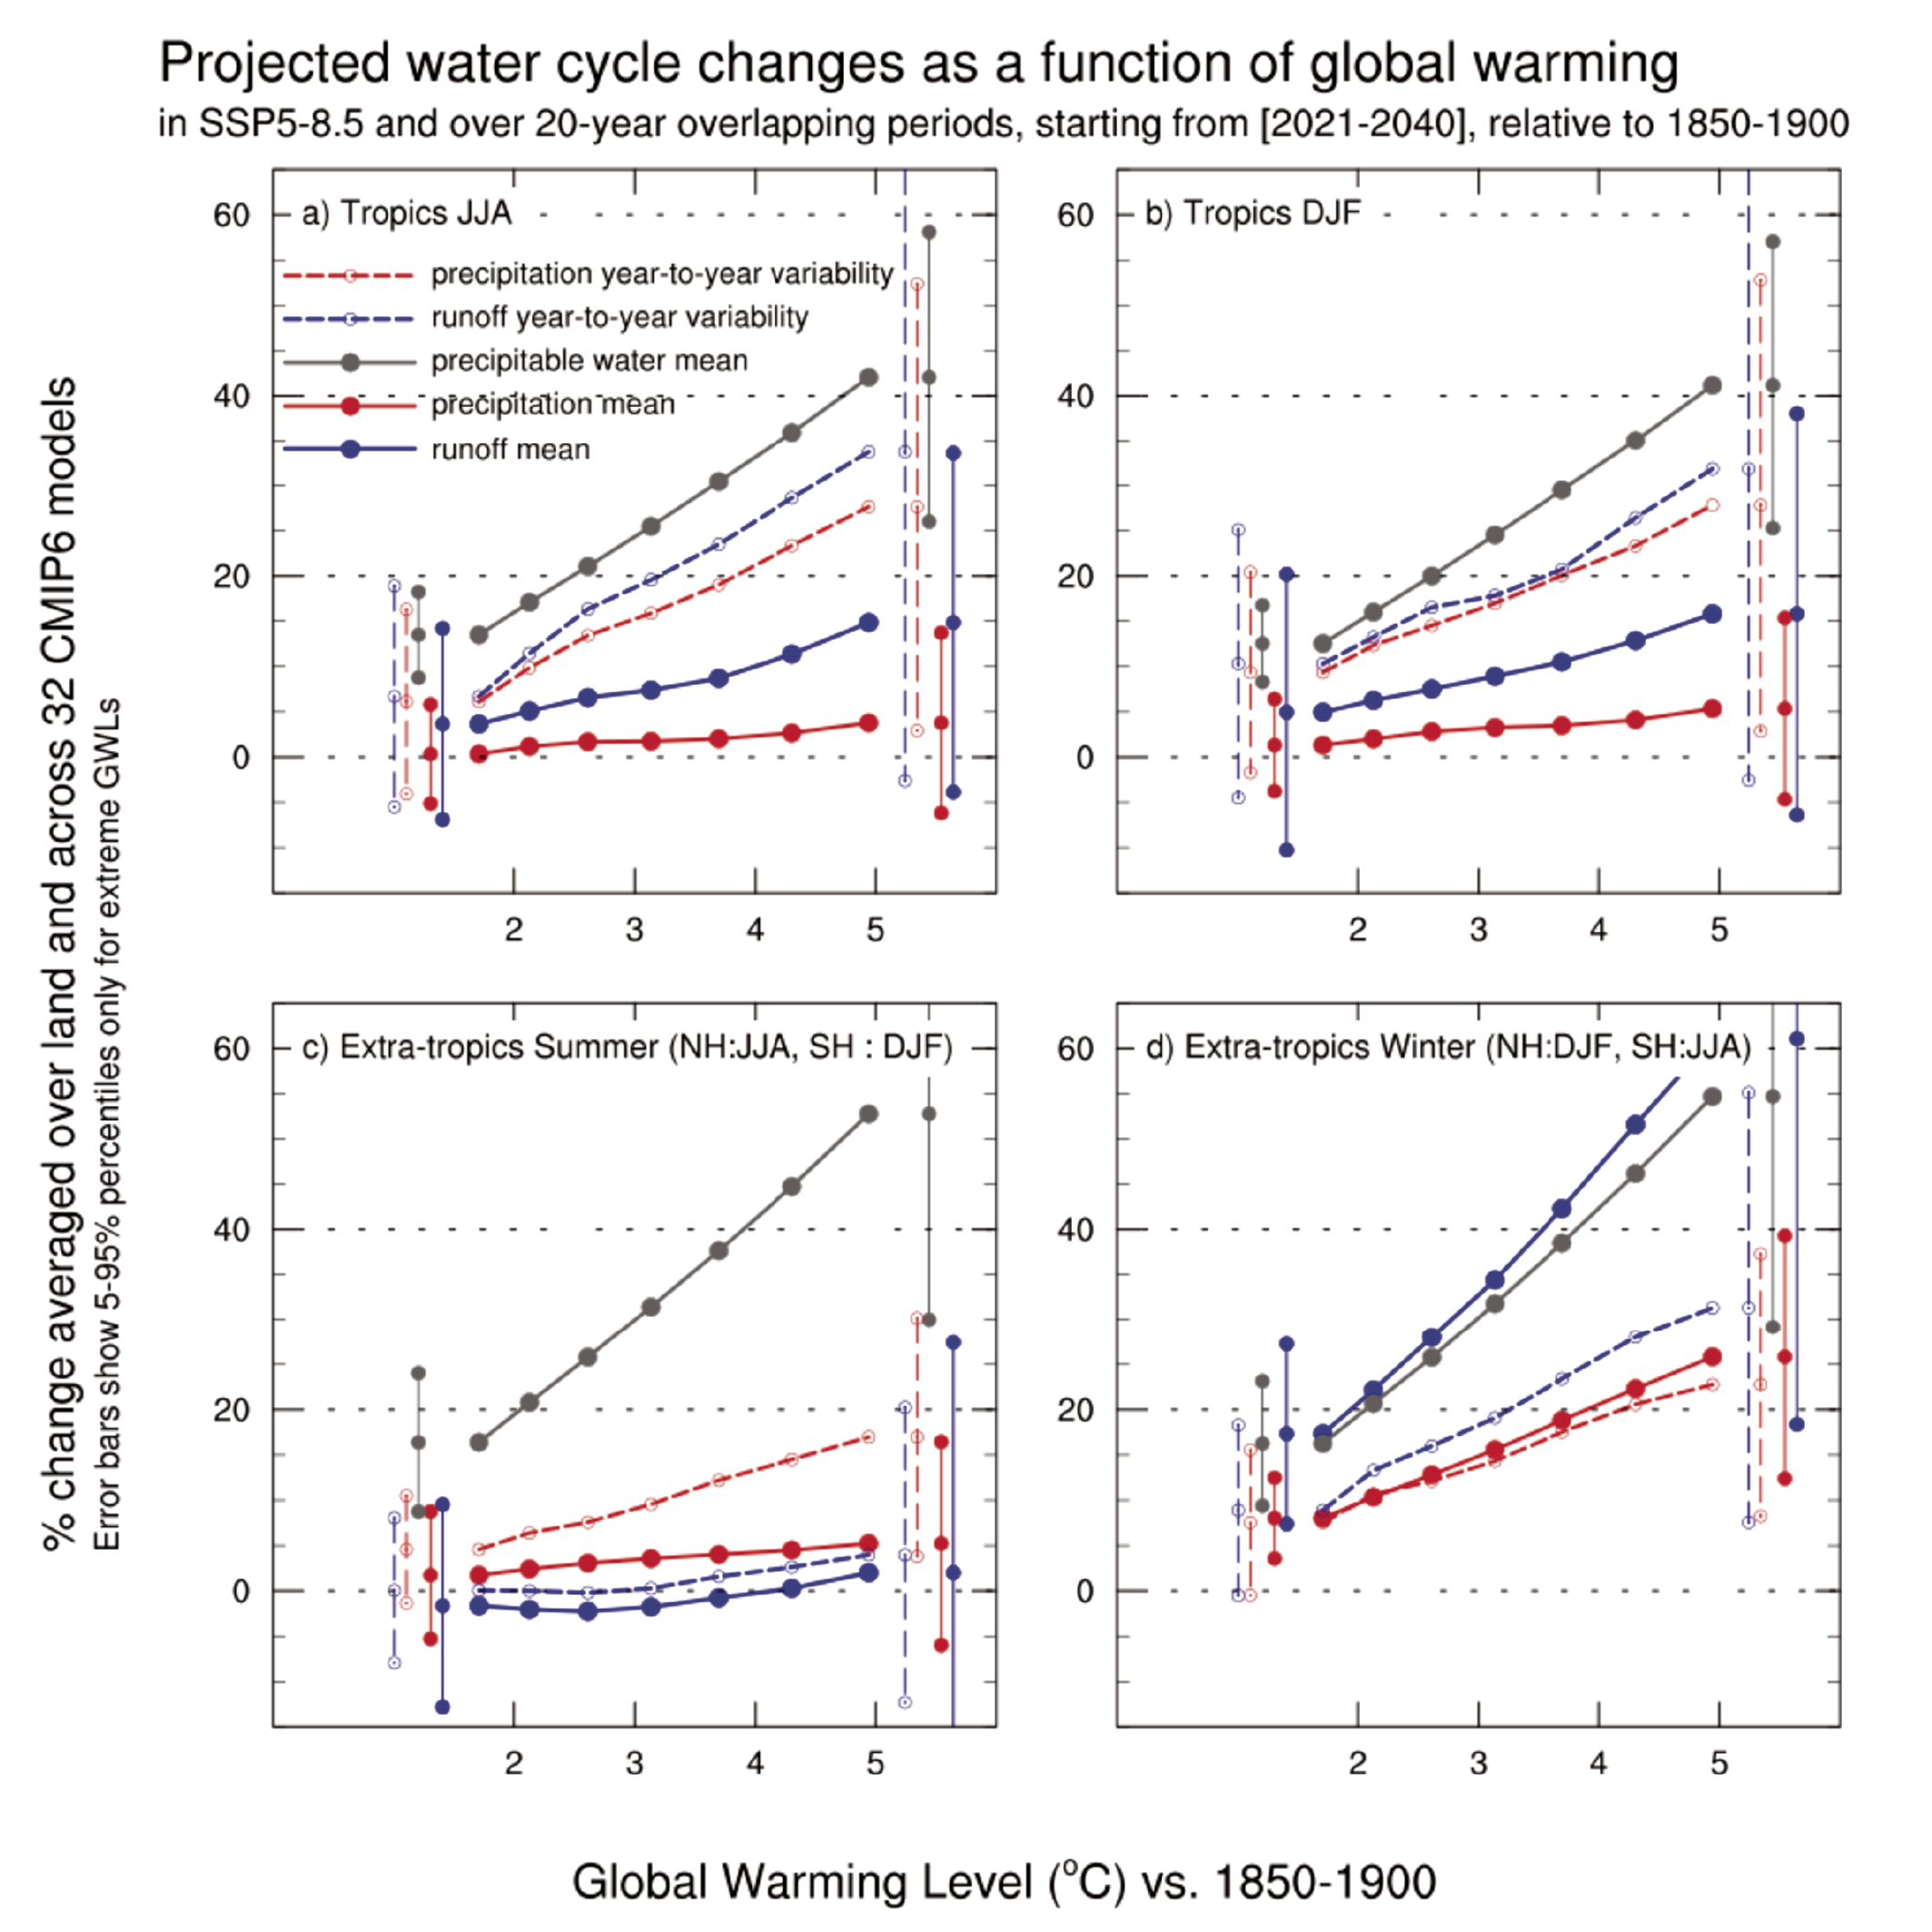
Figure caption
Figure 8.16 | Rate of change in components of water cycle mean and variability across increasing global warming levels. Relative change (%) in seasonal mean total precipitable water (grey line), precipitation (red solid lines), runoff (blue solid lines), as well as in standard deviation of precipitation (red dashed lines) and runoff (blue dashed lines) averaged over extratropical land in (c) summer and (d) winter, and tropical land in (a) June–July–August (JJA) and (b) December–January–February (DJF) as a function of global mean surface temperature for the CMIP6 multi-model mean across the SSP5-8.5 scenario. Extratropical winter refers to DJF for Northern Hemisphere and JJA for Southern Hemisphere (and the reverse for extratropical summer). Each marker indicates a 21-year period centred on consecutive decades between 2015 and 2085 relative to the 1995–2014 base period. Precipitation and runoff variability are estimated by their standard deviation after removing linear trends from each time series. Error bars show the 5–95% confidence interval for the warmest 5°C global warming level. Figure adapted from Pendergrass et al. (2017) and updated with CMIP6 models. Further details on data sources and processing are available in the chapter data table (Table 8.SM.1).