Back chapter figures
Figure 8.25
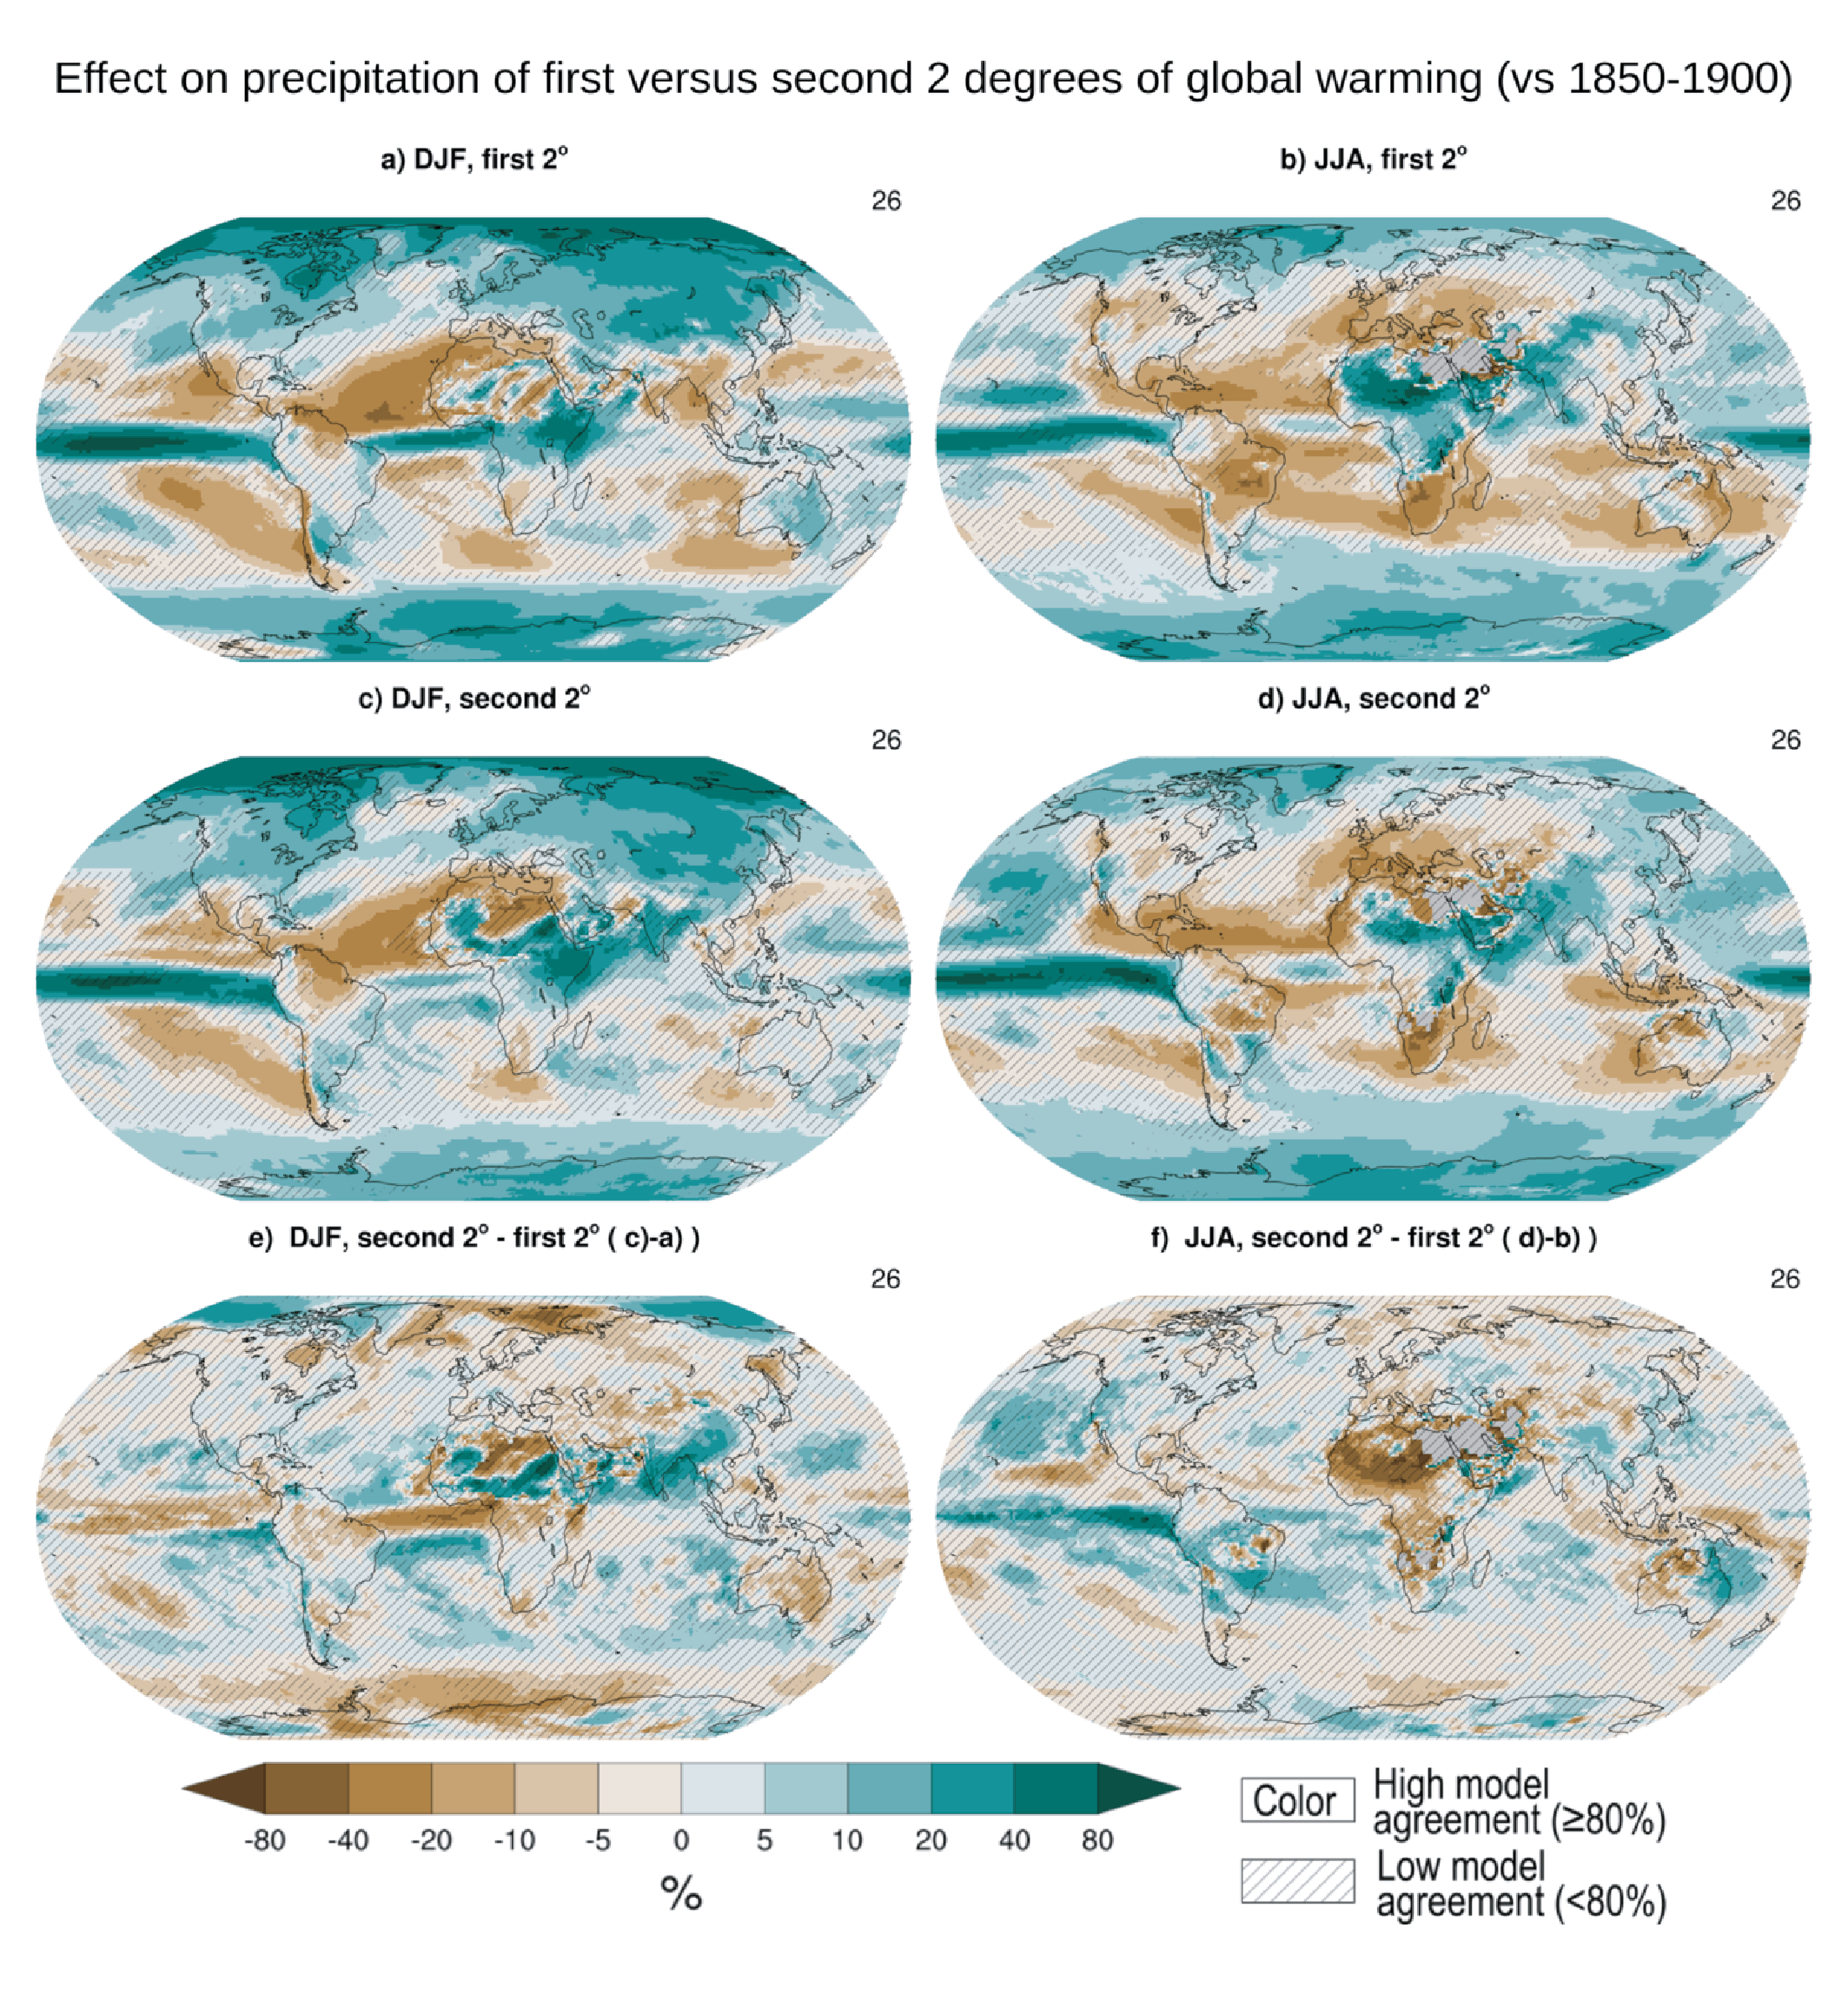
Figure caption
Figure 8.25 | Effect of first versus second 2°C of global warming relative to the 1850–1900 base period on seasonal mean precipitation (mm day–1). CMIP6 multi-model ensemble mean December–January–February (left panels) and June–July–August (right panels) precipitation difference for (a, b) SSP5-8.5 at +2°C (c, d) SSP5-8.5 at +4°C minus SSP5-8.5 at +2°C (second 2°C warming); (e, f) second minus first 2°C fast warming (c–a and d–b). Only models reaching the +4°C warming levels in SSP5-8.5 are considered. Differences are computed based on 21-year time windows centred on the first year reaching or exceeding the selected global warming level using a 21-year running mean global surface atmospheric temperature criterion. Uncertainty is represented using the simple approach. No overlay indicates regions with high model agreement, where ≥80% of models agree on sign of change. Diagonal lines indicate regions with low model agreement, where <80% of models agree on sign of change. For more information on the simple approach, please refer to the Cross-Chapter Box Atlas.1. Further details on data sources and processing are available in the chapter data table (Table 8.SM.1).