Back chapter figures
Figure 8.27
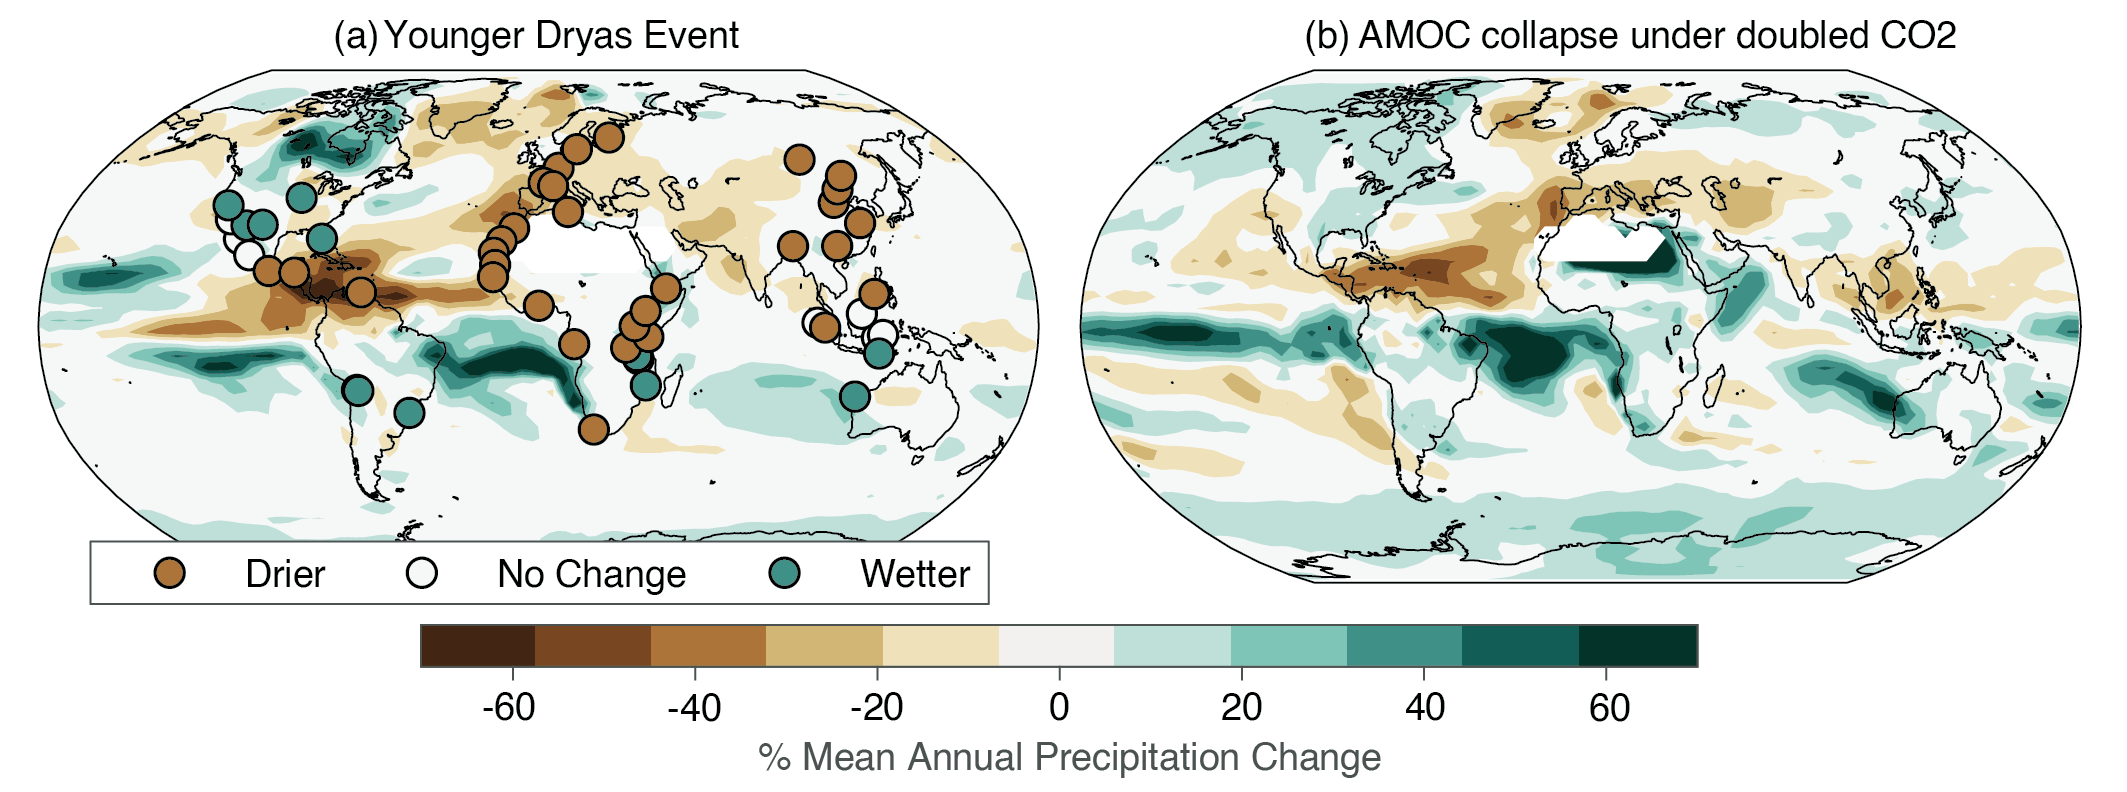
Figure caption
Figure 8.27 | Comparison of reconstructed past and idealized future annual mean precipitation responses to an Atlantic Meridional Overturning Circulation (AMOC) collapse. (a) Model simulation of precipitation response to the Younger Dryas event relative to the preceding warm Bølling-Allerød period (base colours, calculated as the difference between 12,600–11,700 years before the present (BP) and 14,500–12,900 BP from the Transient Climate Evolution (TraCE) paleoclimate simulation of Liu et al., 2009), with paleoclimate proxy evidence superimposed on top (dots). (b) Model simulation of precipitation response to an abrupt collapse in AMOC under a doubling of 1990 CO2 levels (after W. Liu et al., 2017). Regions with rainfall rates below 20 mm yr–1 are masked. Further details on data sources and processing are available in the chapter data table (Table 8.SM.1).