Back chapter figures
Figure 8.5
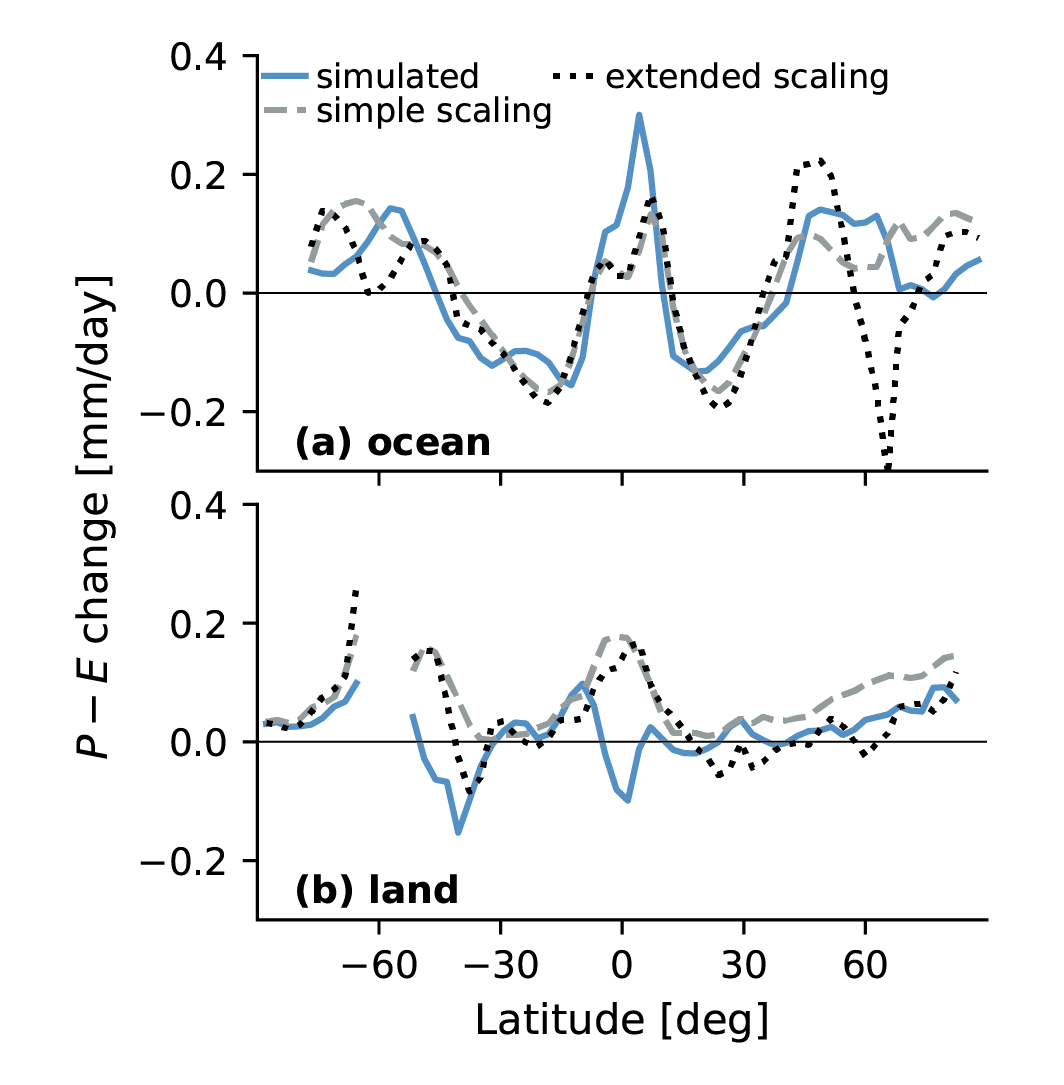
Figure caption
Figure 8.5 | Zonally-averaged annual mean changes in precipitation minus evaporation (P–E) over (a) ocean and (b) land between the historical (1995–2014) andSSP2-4.5 (2081–2100) CMIP6 simulations (blue lines, an average of the CanESM5 and MRI-ESM2-0 models). Dashed lines show estimated P–E changes using a simple thermodynamic scaling (Held and Soden, 2006); dotted lines show estimates using an extended scaling (Byrne and O’Gorman, 2016). All curves have been smoothed in latitude using a three grid-point moving-average filter. Further details on data sources and processing are available in the chapter data table (Table 8.SM.1).