Back chapter figures
Figure 9.14
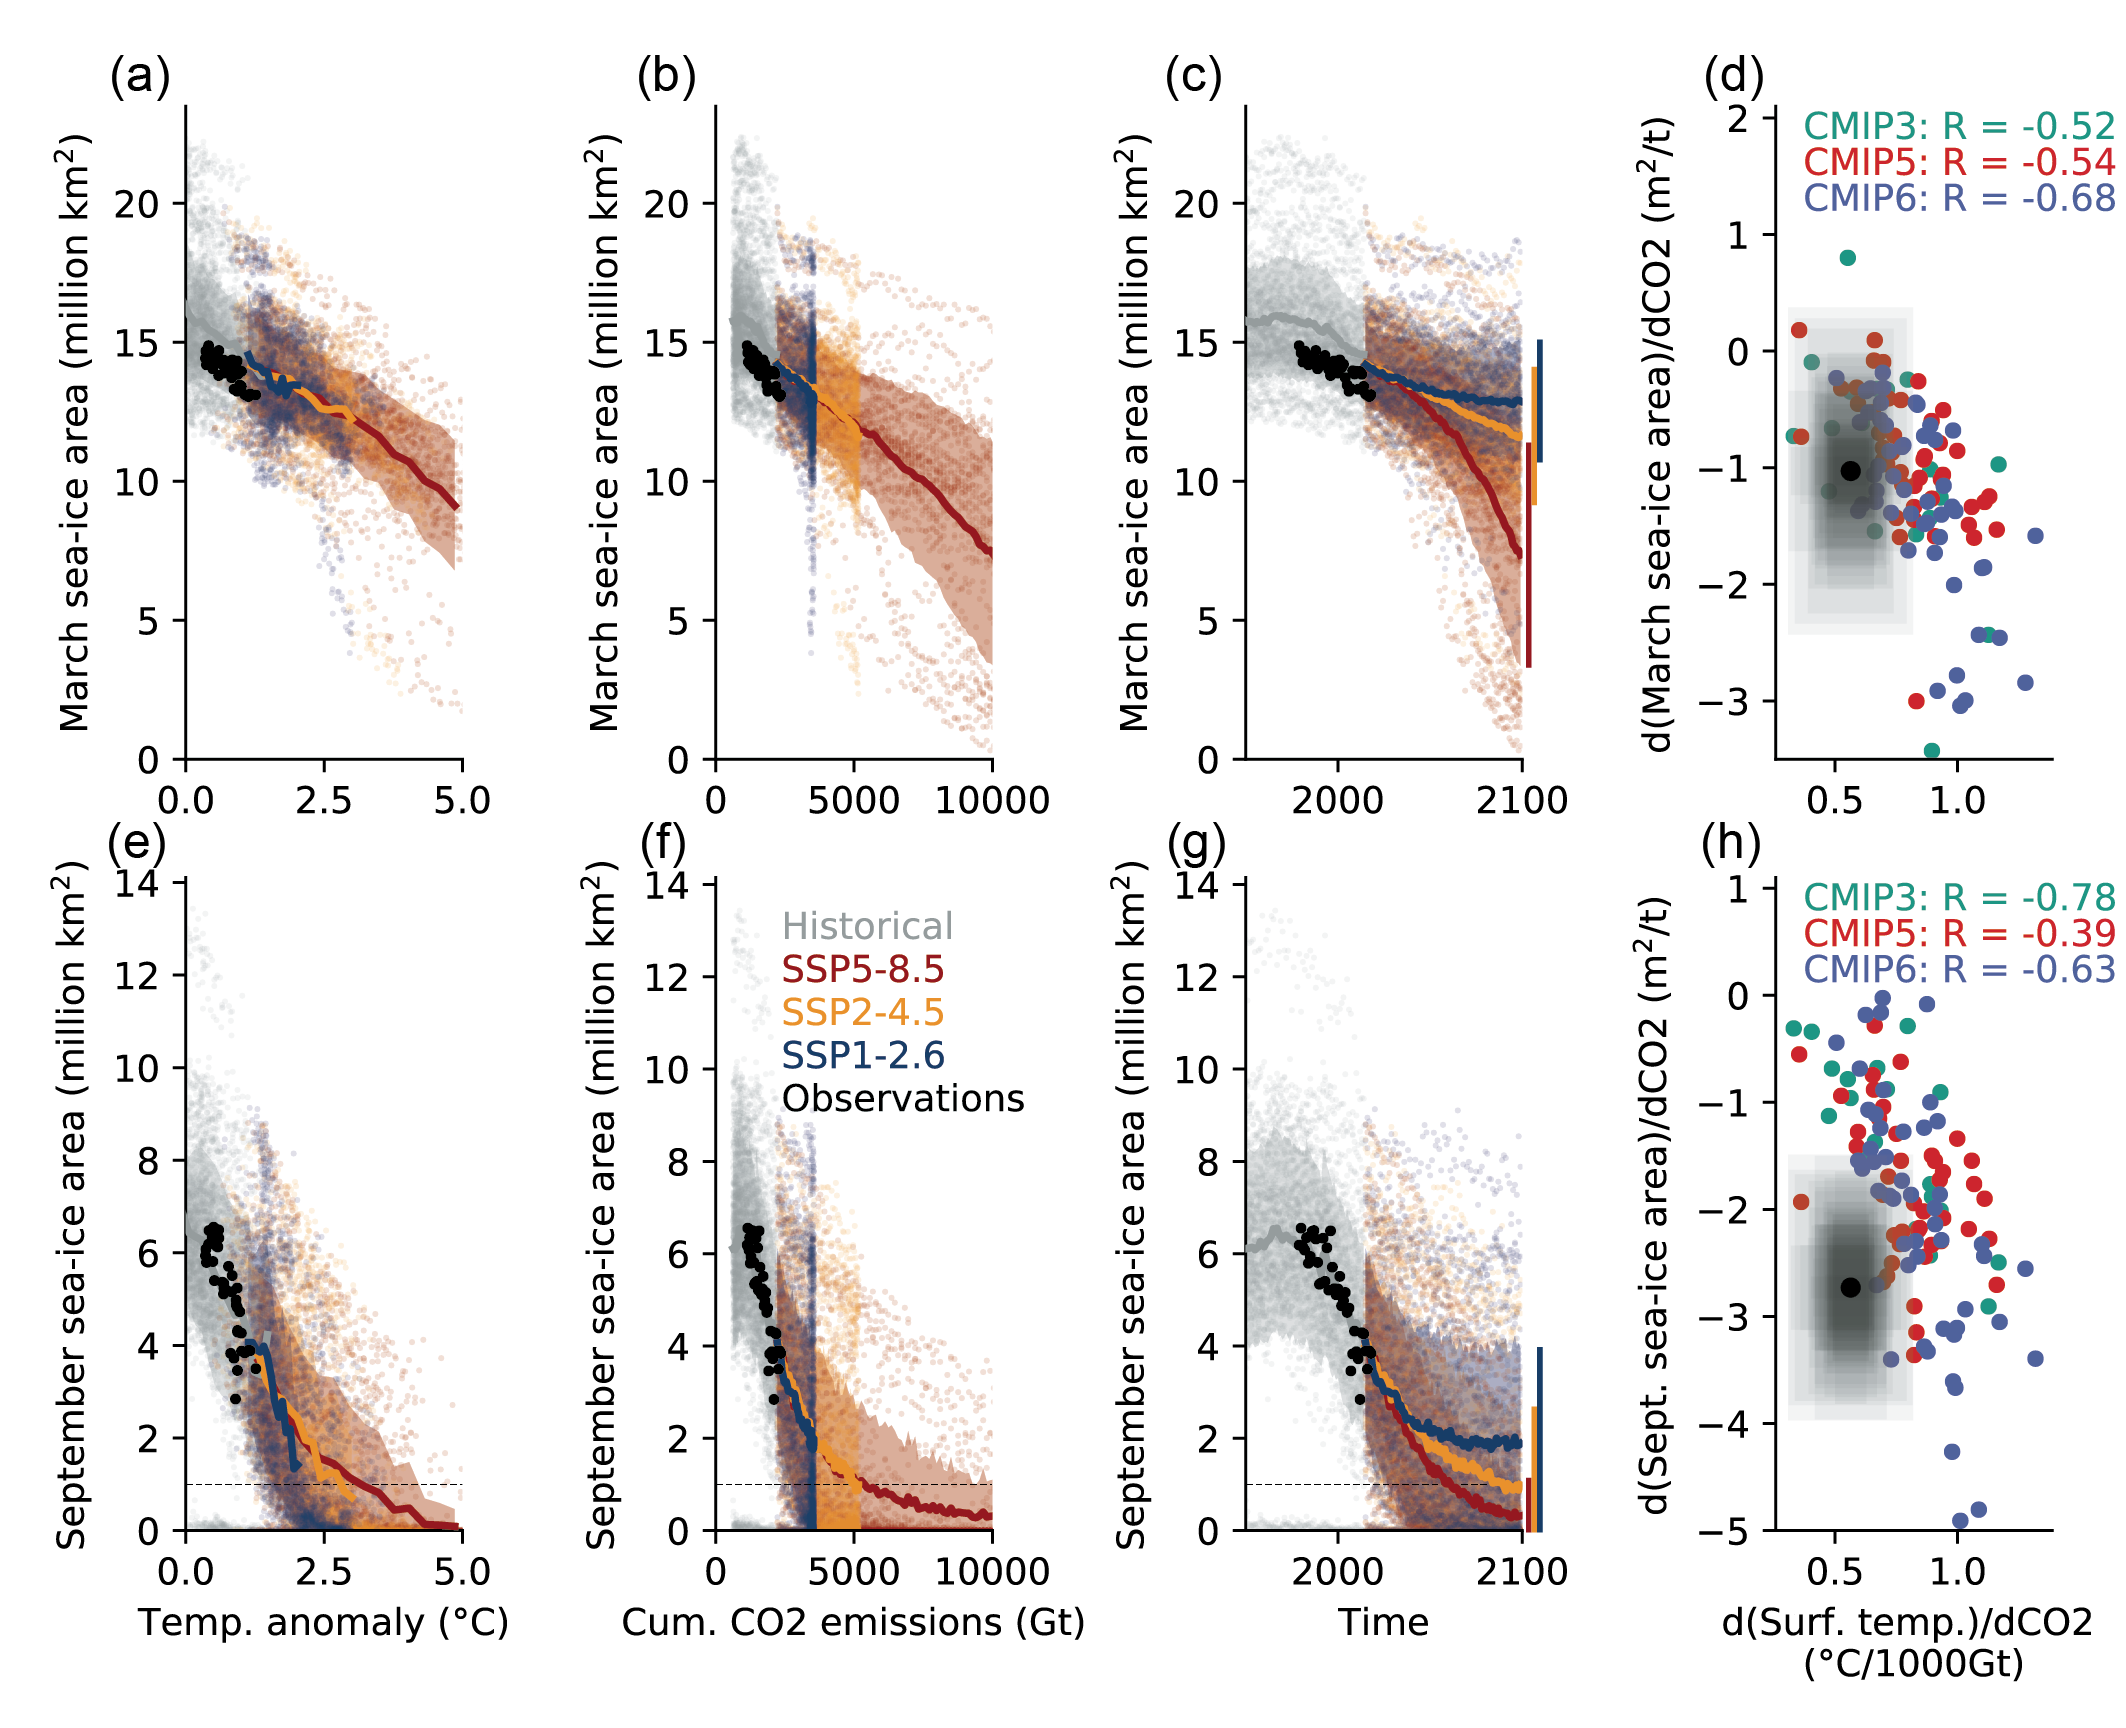
Figure caption
Figure 9.14 | Monthly mean March (a–d) and September (e–h) sea ice area as a function of global surface air temperature (GSAT) anomaly (a, e); cumulative anthropogenic CO2 emissions (b, f); year (c, g) in Coupled Model Intercomparison Project Phase 6 (CMIP6) model simulations (shading, ensemble mean as bold line) and in observations (black dots). Panels (d) and (h) show the sensitivity of sea ice loss to anthropogenic CO2 emissions as a function of the modelled sensitivity of GSAT to anthropogenic CO2 emissions. In panels (d) and (h), the black dot denotes the observed sensitivity, while the shading around it denotes internal variability as inferred from CMIP6 simulations (after Notz and SIMIP Community, 2020). Further details on data sources and processing are available in the chapter data table (Table 9.SM.9).