Back chapter figures
Figure 9.21
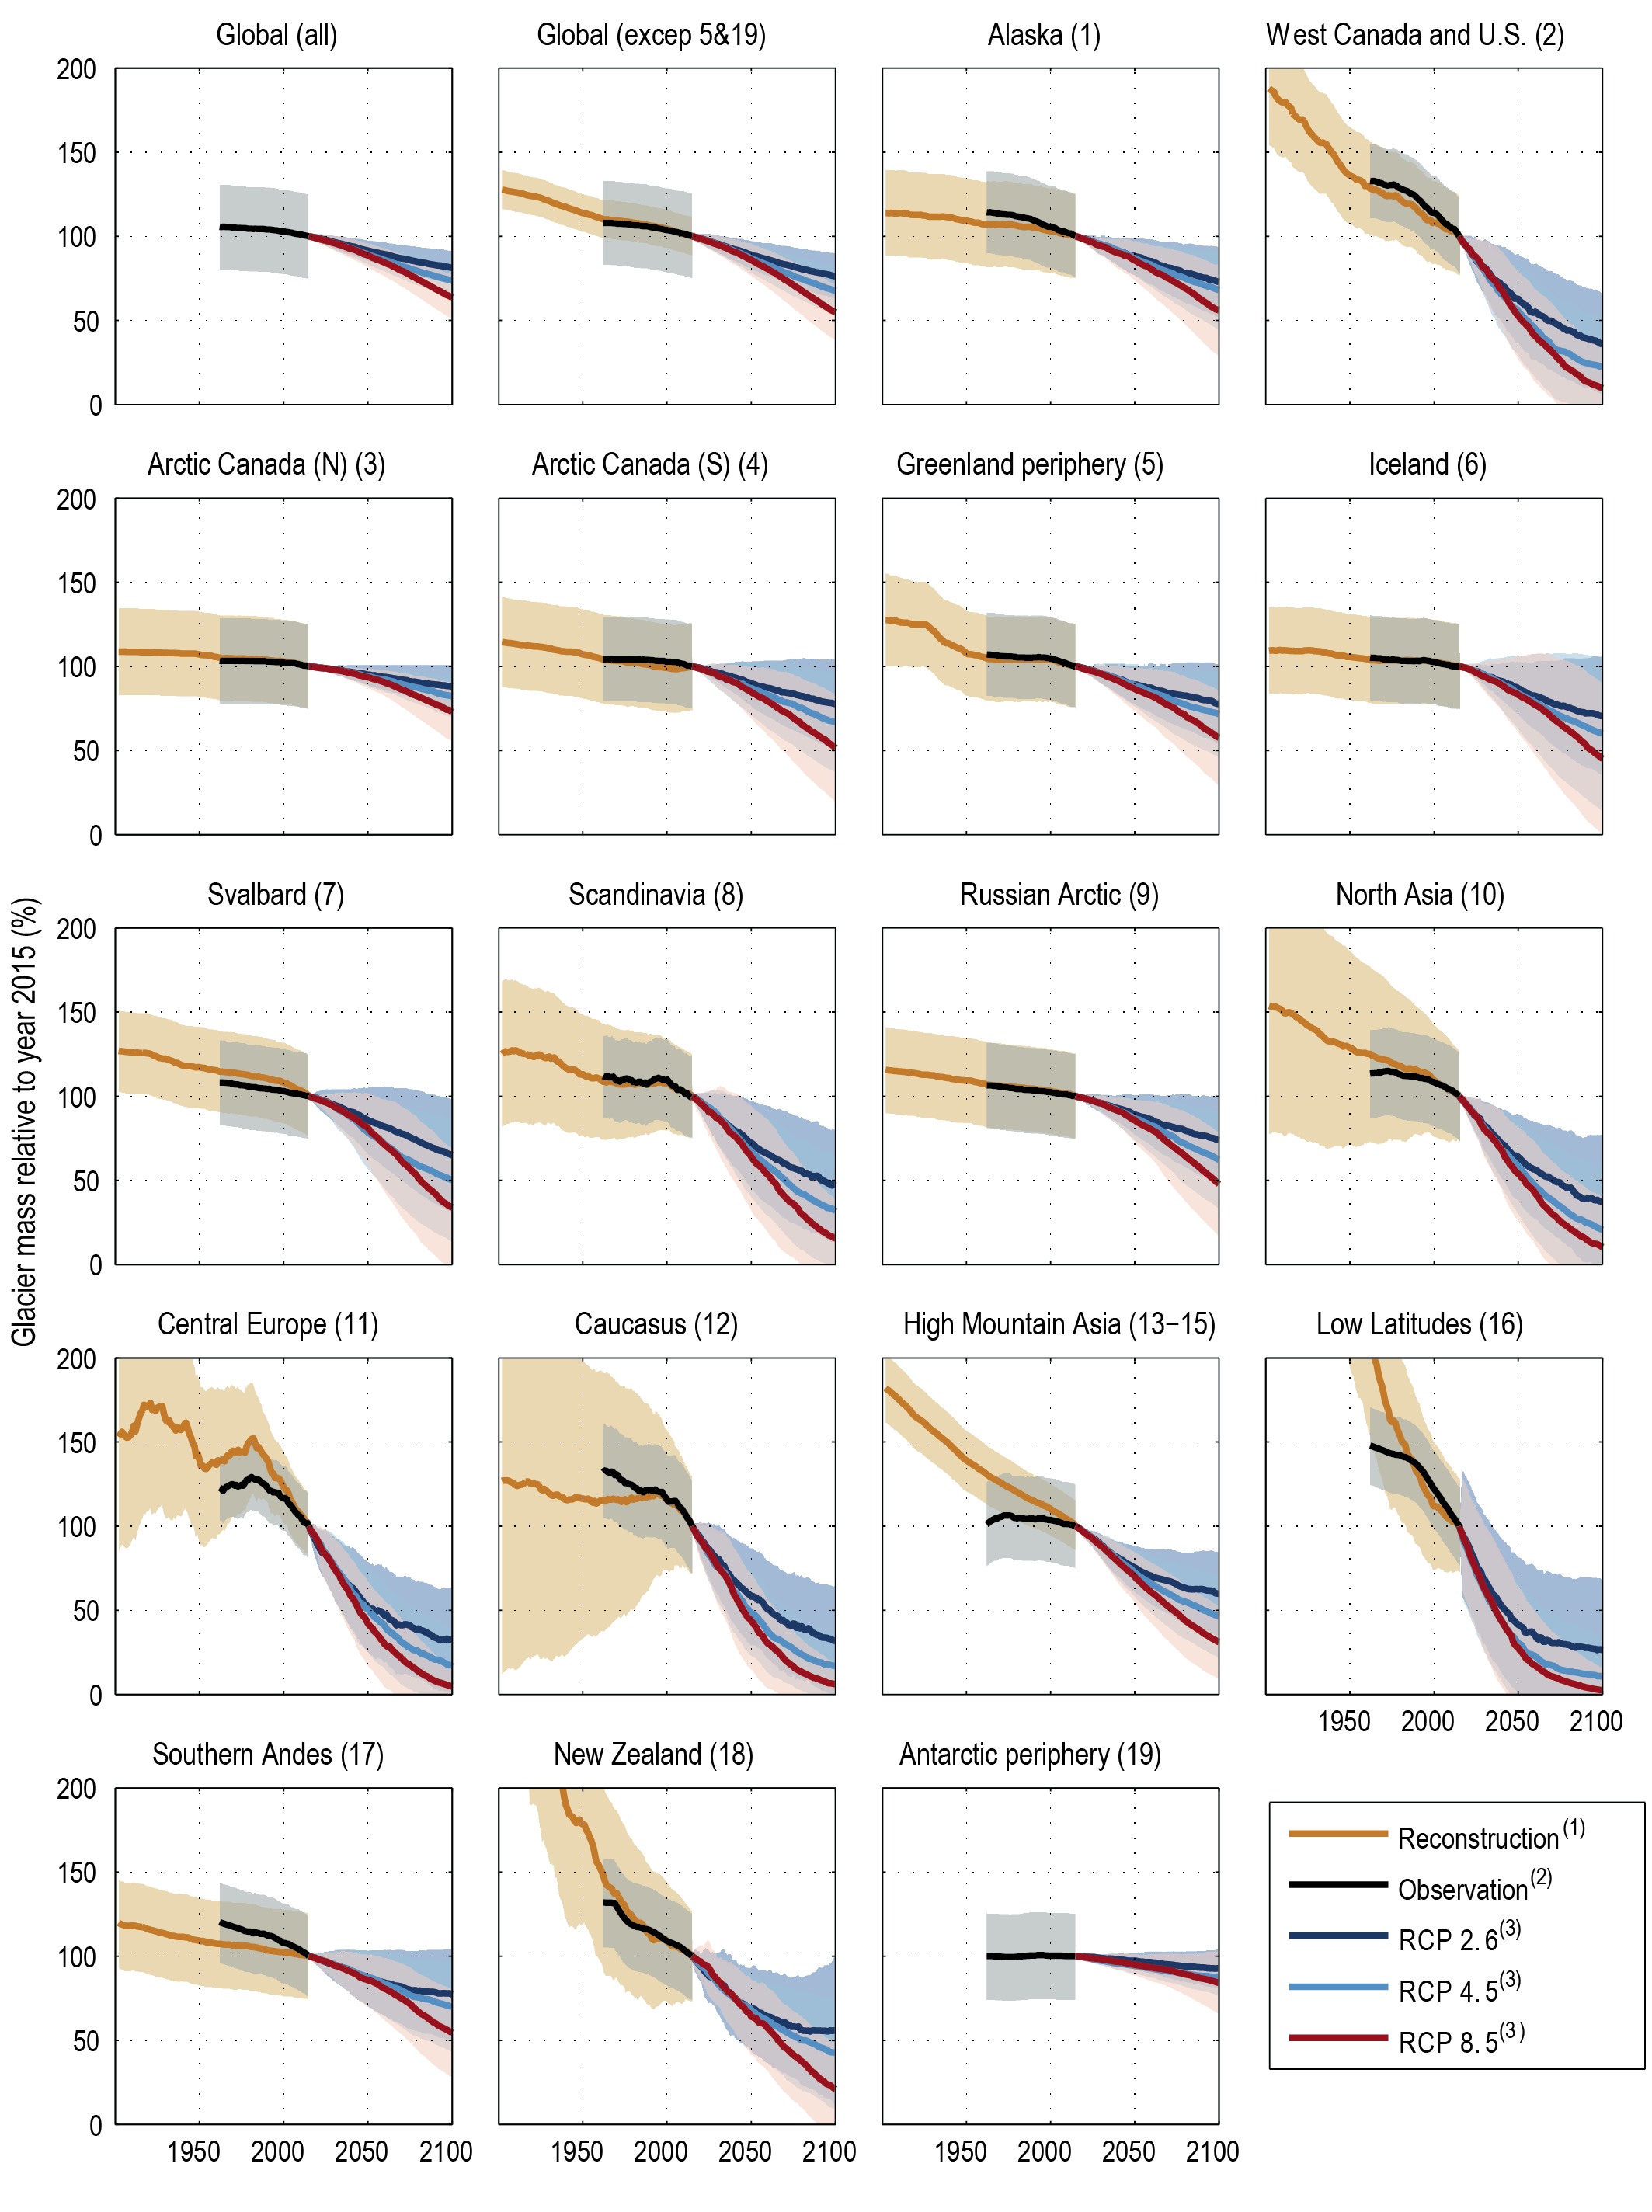
Figure caption
Figure 9.21 | Global and regional glacier mass evolution between 1901 and 2100 relative to glacier mass in 2015. Reconstructed glacier mass change through the 20th century (Marzeion et al., 2015) and observed during 1961–2016 (Zemp et al., 2019). Projected (2015–2100) glacier mass evolution is based on the median of three RCP emissions scenarios (Marzeion et al., 2020). In all cases, uncertainties are the 90% confidence interval. For a better comparison between regions, the maximum relative mass change was set to 200%, although for three regions, the volume changes between 1901 and 2015 exceeded that value. For the Low Latitude, New Zealand, and High Mountain Asia glaciers, the changes were larger than 1000%, 350%, and 250%, respectively. See Figure 9.2 for the location of each region. Further details on data sources and processing are available in the chapter data table (Table 9.SM.9).