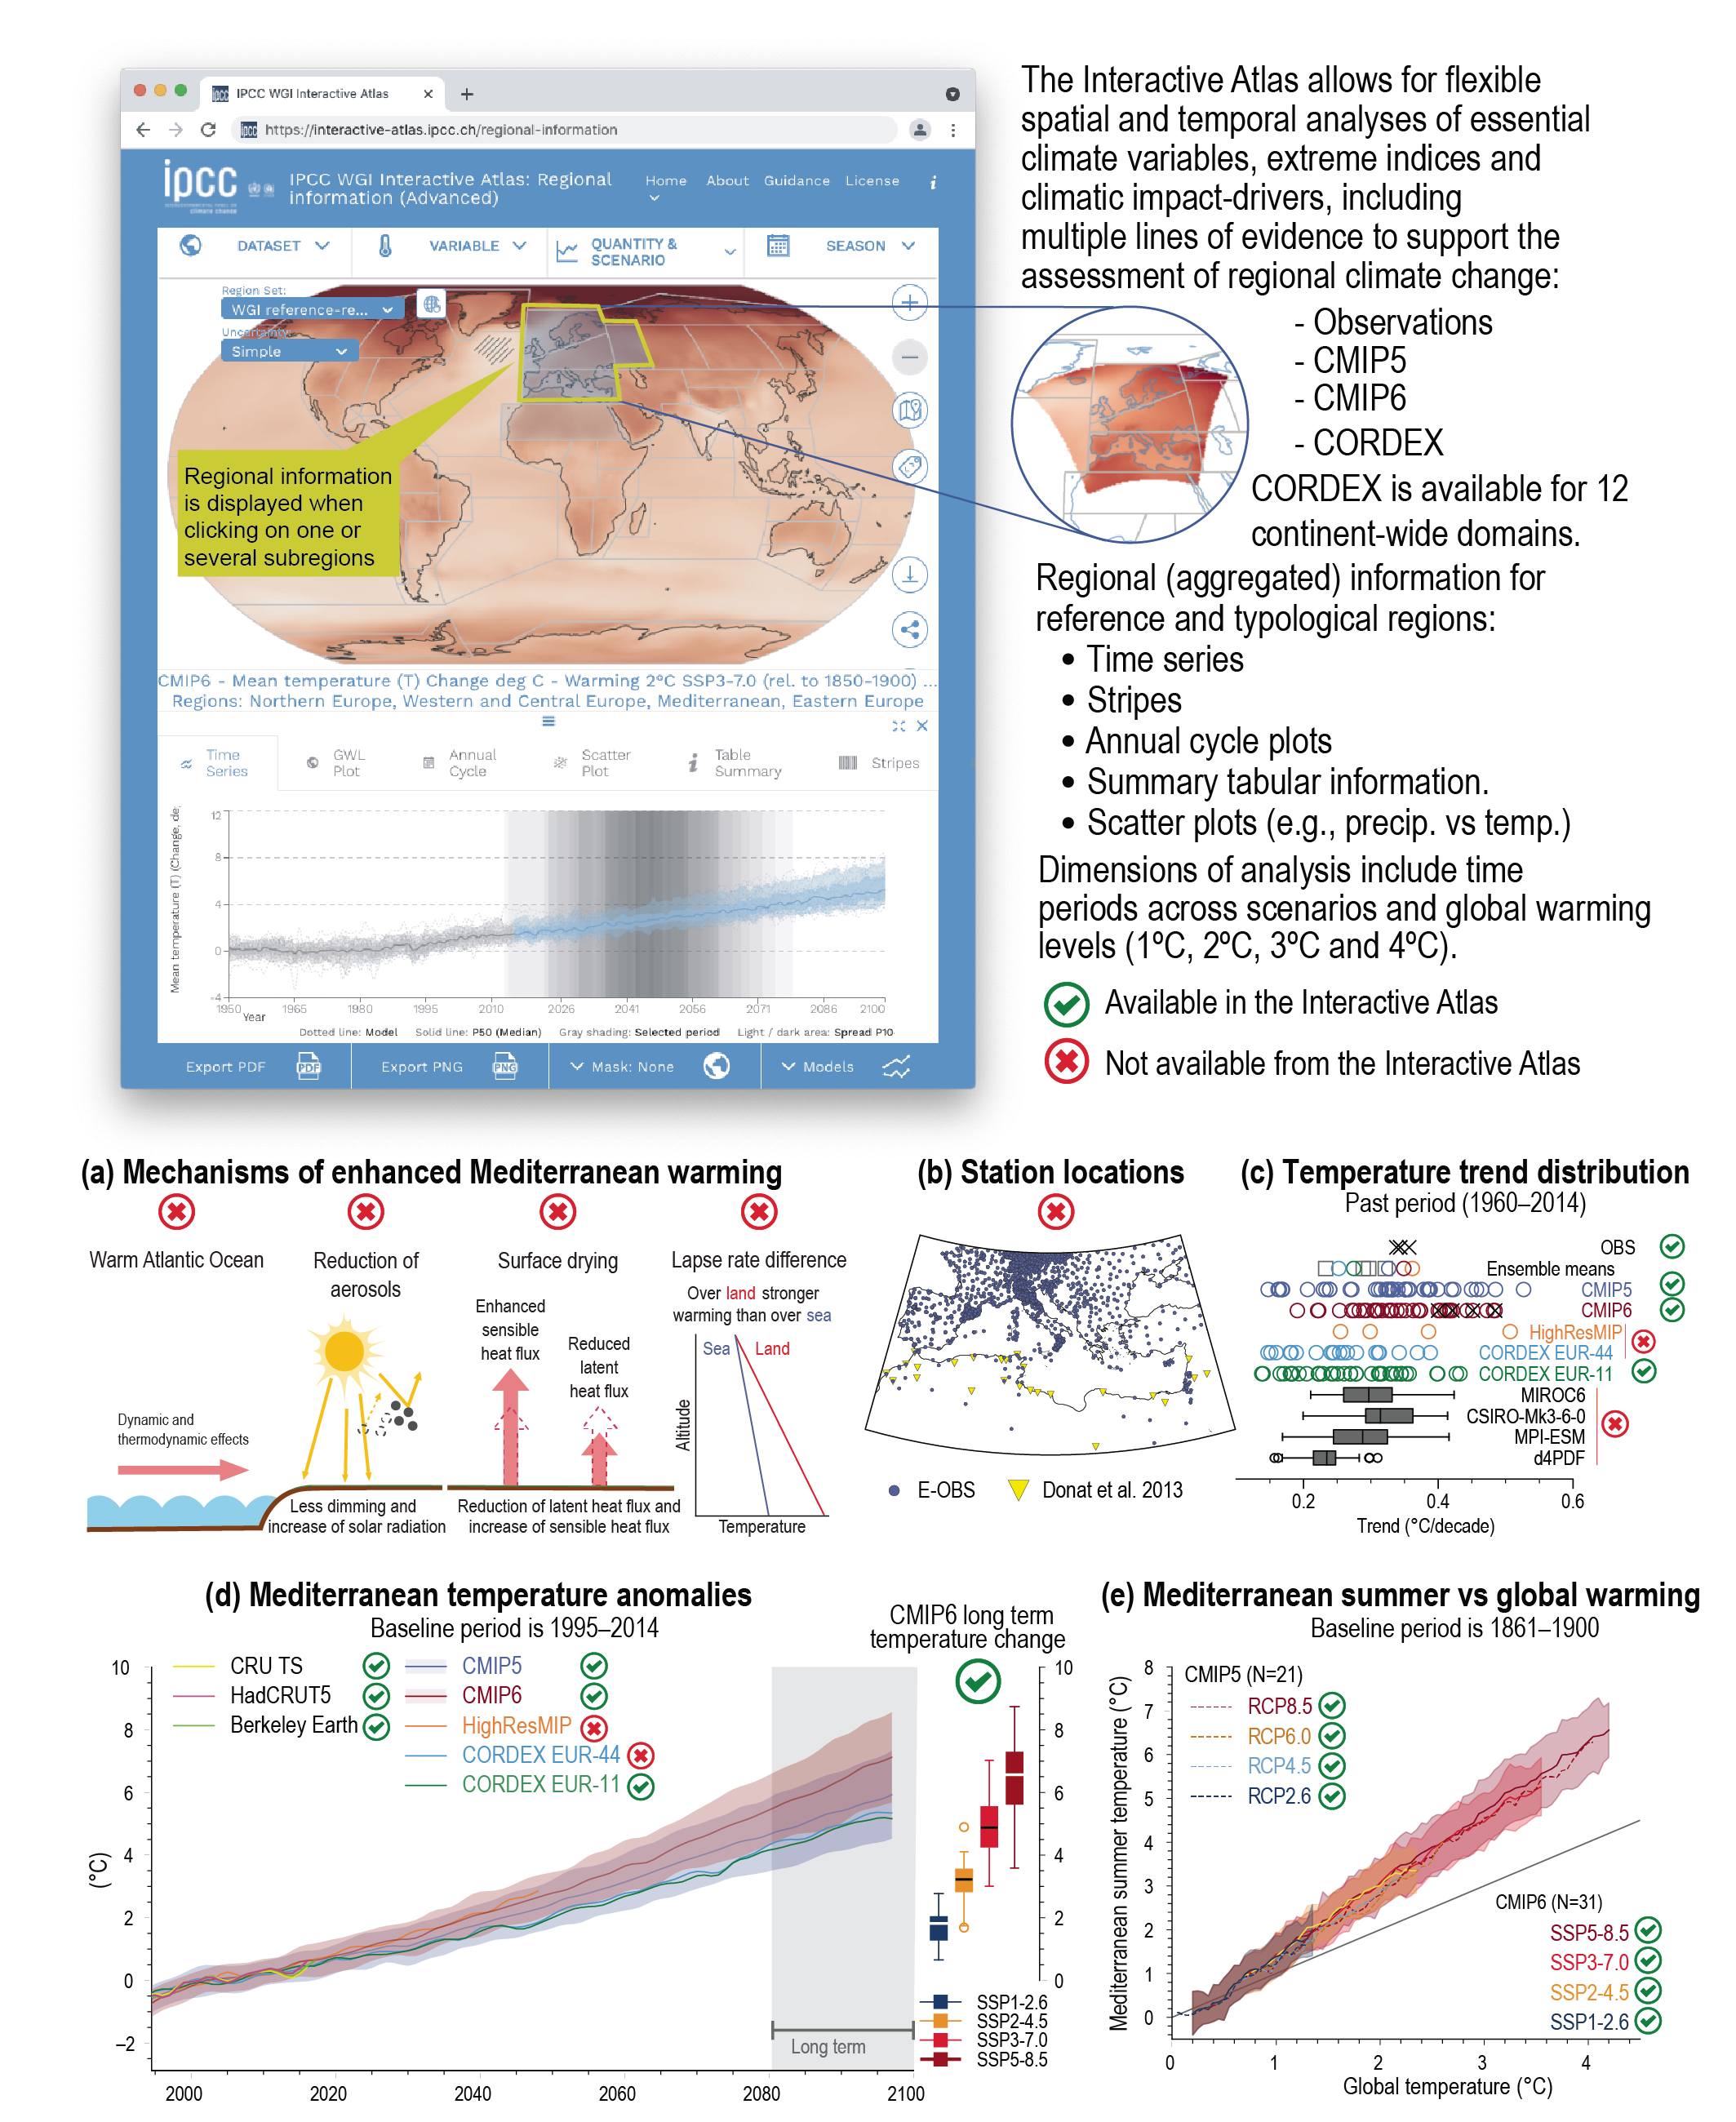
Box TS.12, Figure 1
Figure caption
Box TS.12, Figure 1 | Example of generating regional climate information from multiple lines of evidence for the case of Mediterranean summer warming. Box TS.12 The intent of this figure is to provide an example of using different lines of evidence to assess the confidence in or likelihood of a projected change in regional climate and which of these lines of evidence are available to view and explore in the Interactive Atlas. (a) Mechanisms and feedbacks involved in enhanced Mediterranean summer warming. (b) Locations of observing stations from different datasets. (c) Distribution of 1960–2014 summer temperature trends (°C per decade) for observations (black crosses), CMIP5 (blue circles), CMIP6 (red circles), HighResMIP (orange circles), CORDEX EUR-44 (light blue circles), CORDEX EUR-11 (green circles), and selected single model initial-condition large ensembles (SMILEs; grey boxplots, MIROC6, CSIRO-Mk3-6-0, MPI-ESM and d4PDF). (d) Time series of area averaged (25°N–50°N, 10°W–40°E) land point summer temperature anomalies (°C, baseline period is 1995–2014): the boxplot shows long term (2081–2100) temperature changes of different CMIP6 scenarios in respect to the baseline period. (e) Projected Mediterranean summer warming in comparison to global annual mean warming of CMIP5 (RCP2.6, RCP4.5, RCP6.0 and RCP8.5) and CMIP6 (SSP1-2.6, SSP2-4.5, SSP3-7.0 and SSP5-8.5) ensemble means (lines) and spread (shading). {Figure 10.20, Figure 10.21, Figure Atlas.8}
