Back chapter figures
Figure TS.12
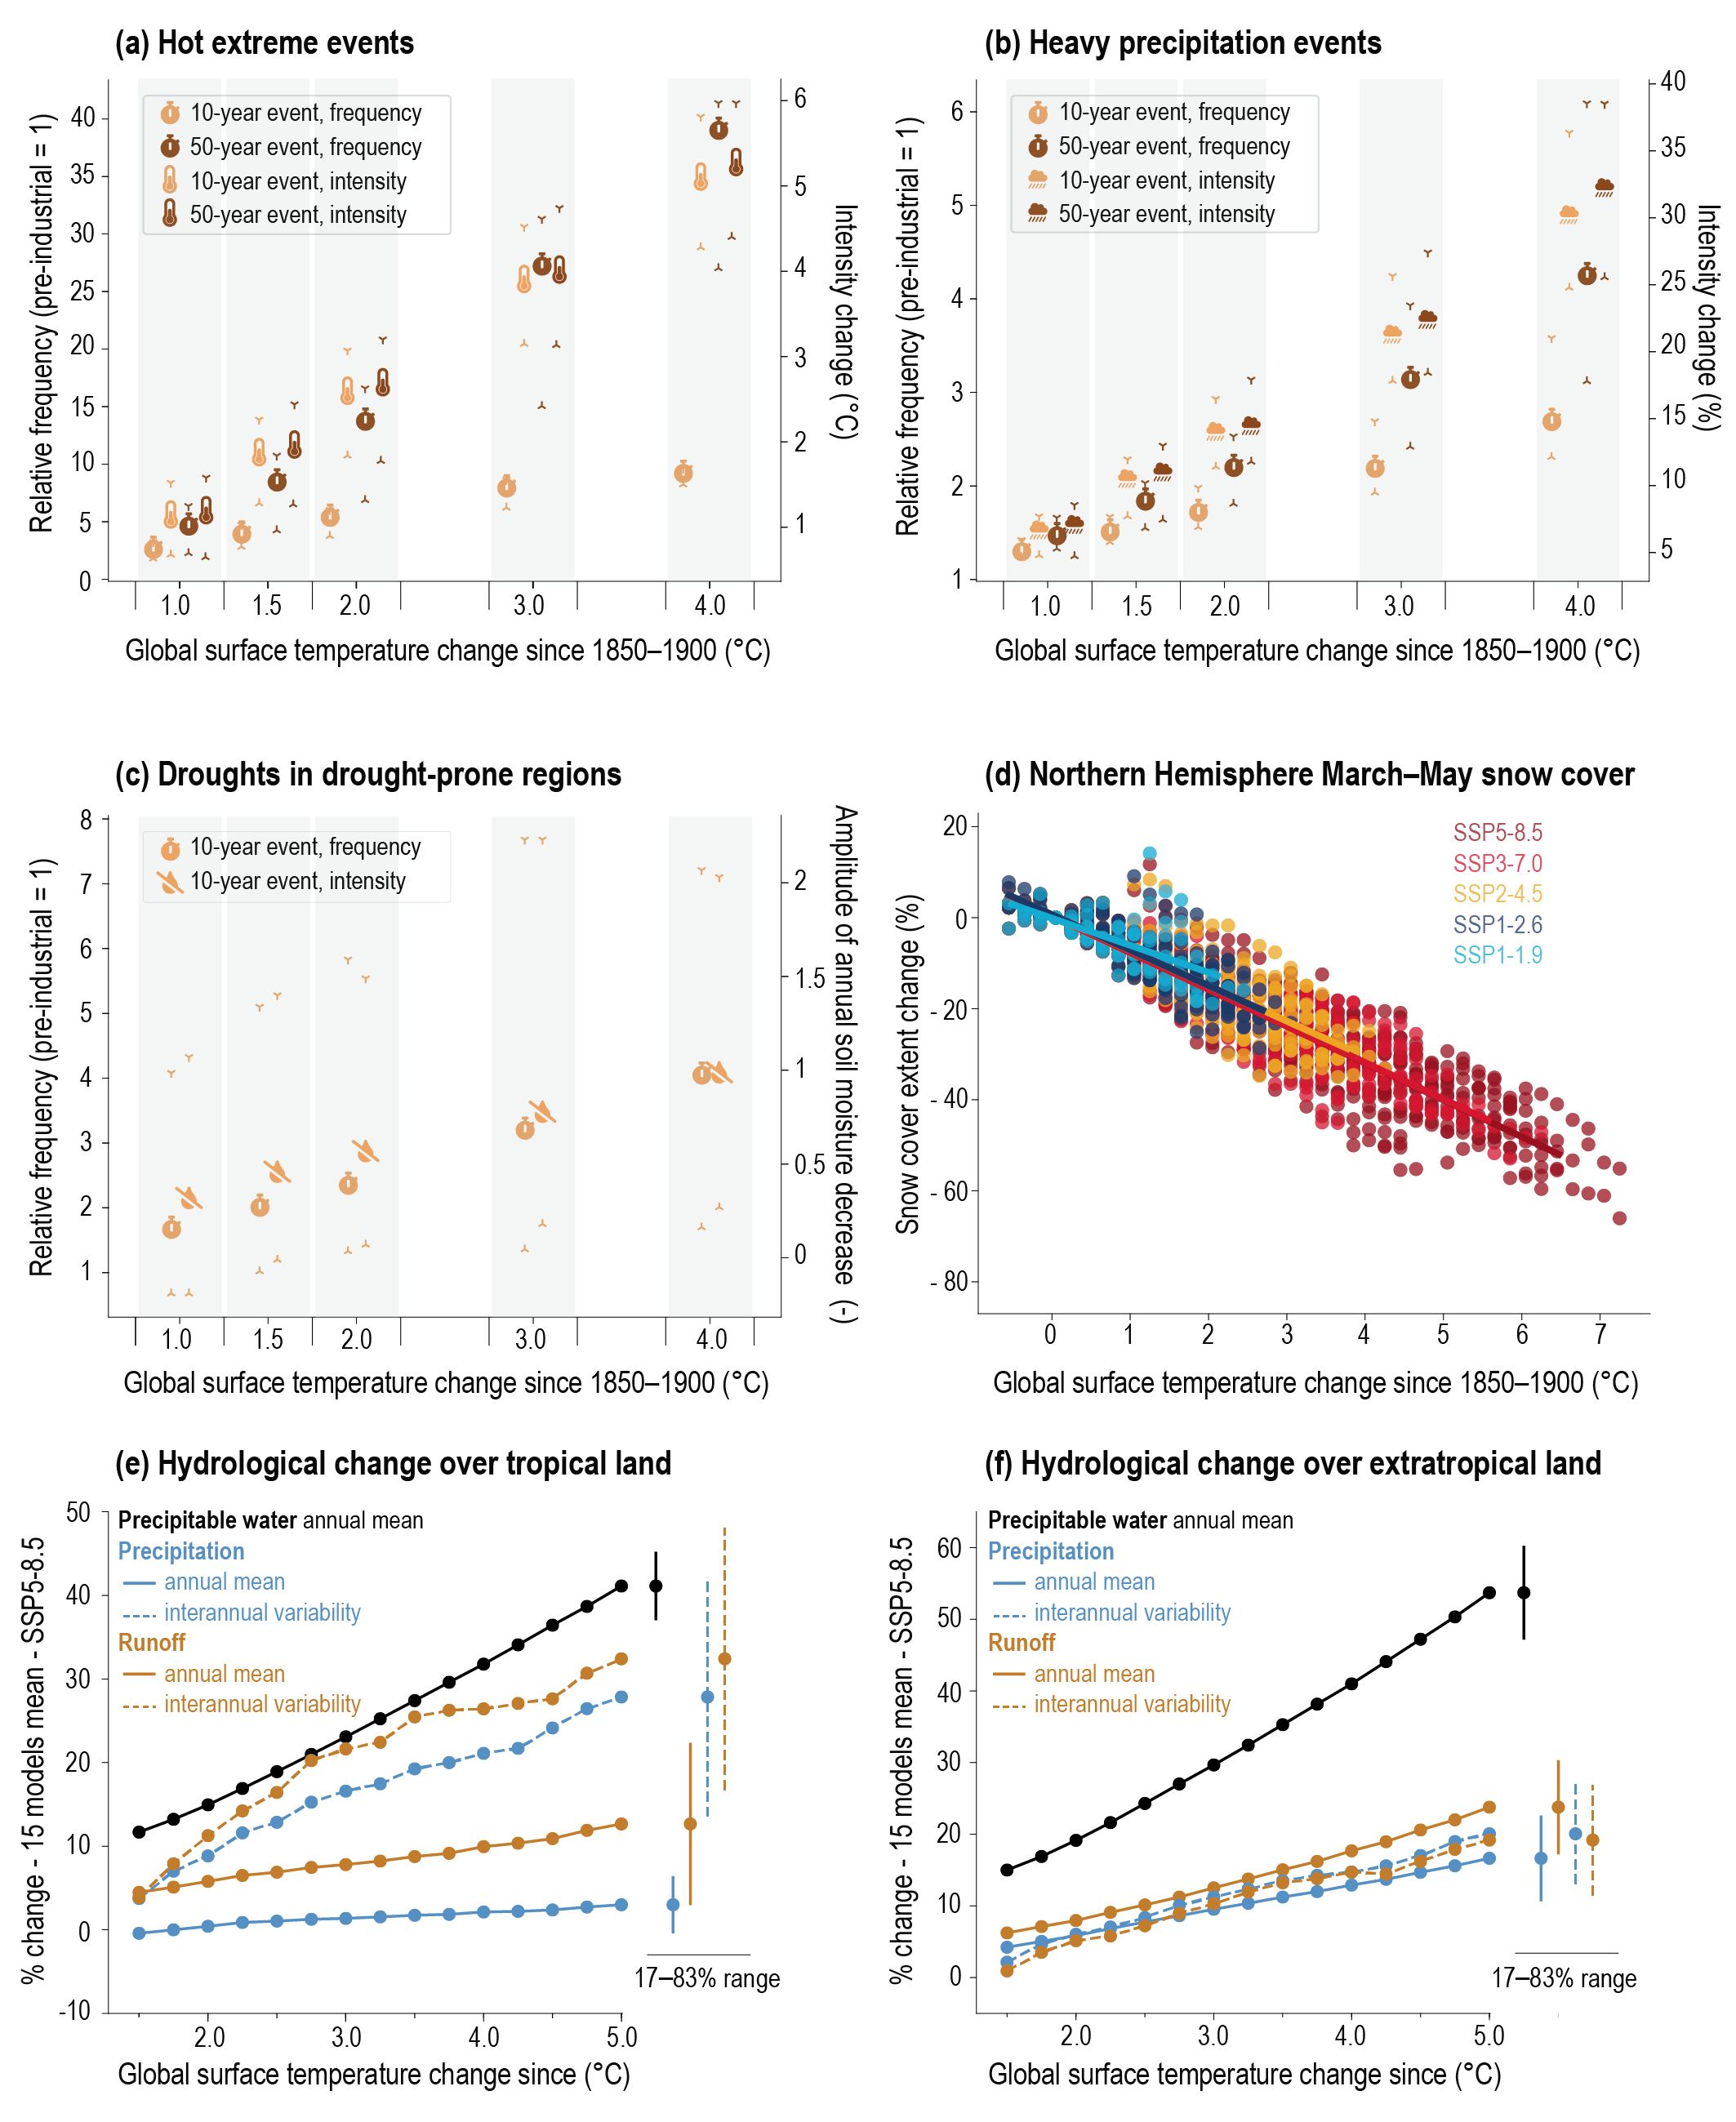
Figure caption
Figure TS.12 | Land-related changes relative to the 1850-1900 as a function of global warming levels. The intent of this figure is to show that extremes and mean land variables change consistently with warming levels and to show the changes with global warming levels of water cycle indicators (i.e., precipitation and runoff) over tropical and extratropical land in terms of mean and interannual variability (interannual variability increases at a faster rate than the mean). (a) Changes in the frequency (left scale) and intensity (in °C, right scale) of daily hot extremes occurring every 10 and 50 years. (b) as (a), but for daily heavy precipitation extremes, with intensity change in %. (c) Changes in 10-year droughts aggregated over drought-prone regions (WNA, CNA, NCA, SCA, NSA, NES, SAM, SWS, SSA, WCE, MED, WSAF, ESAF, MDG, SAU, and EAU; for definitions of these regions, see Figure Atlas.2), with drought intensity (right scale) represented by the change of annual mean soil moisture, normalized with respect to interannual variability. Limits of the 5%−95% confidence interval are shown in panels (a–c). (d) Changes in Northern Hemisphere spring (March–April–May) snow cover extent relative to 1850–1900; (e,f) Relative change (%) in annual mean of total precipitable water (grey line), precipitation (red solid lines), runoff (blue solid lines) and in standard deviation (i.e., variability) of precipitation (red dashed lines) and runoff (blue dashed lines) averaged over (e) tropical and (f) extratropical land as function of global warming levels. Coupled Model Intercomparison Project Phase 6 (CMIP6) models that reached a 5°C warming level above the 1850–1900 average in the 21st century in SSP5-8.5 have been used. Precipitation and runoff variability are estimated by respective standard deviation after removing linear trends. Error bars show the 17–83% confidence interval for the warmest +5°C global warming level. {Figures 8.16, 9.24, 11.6, 11.7, 11.12, 11.15, 11.18 and Atlas.2}