Back chapter figures
Figure TS.18
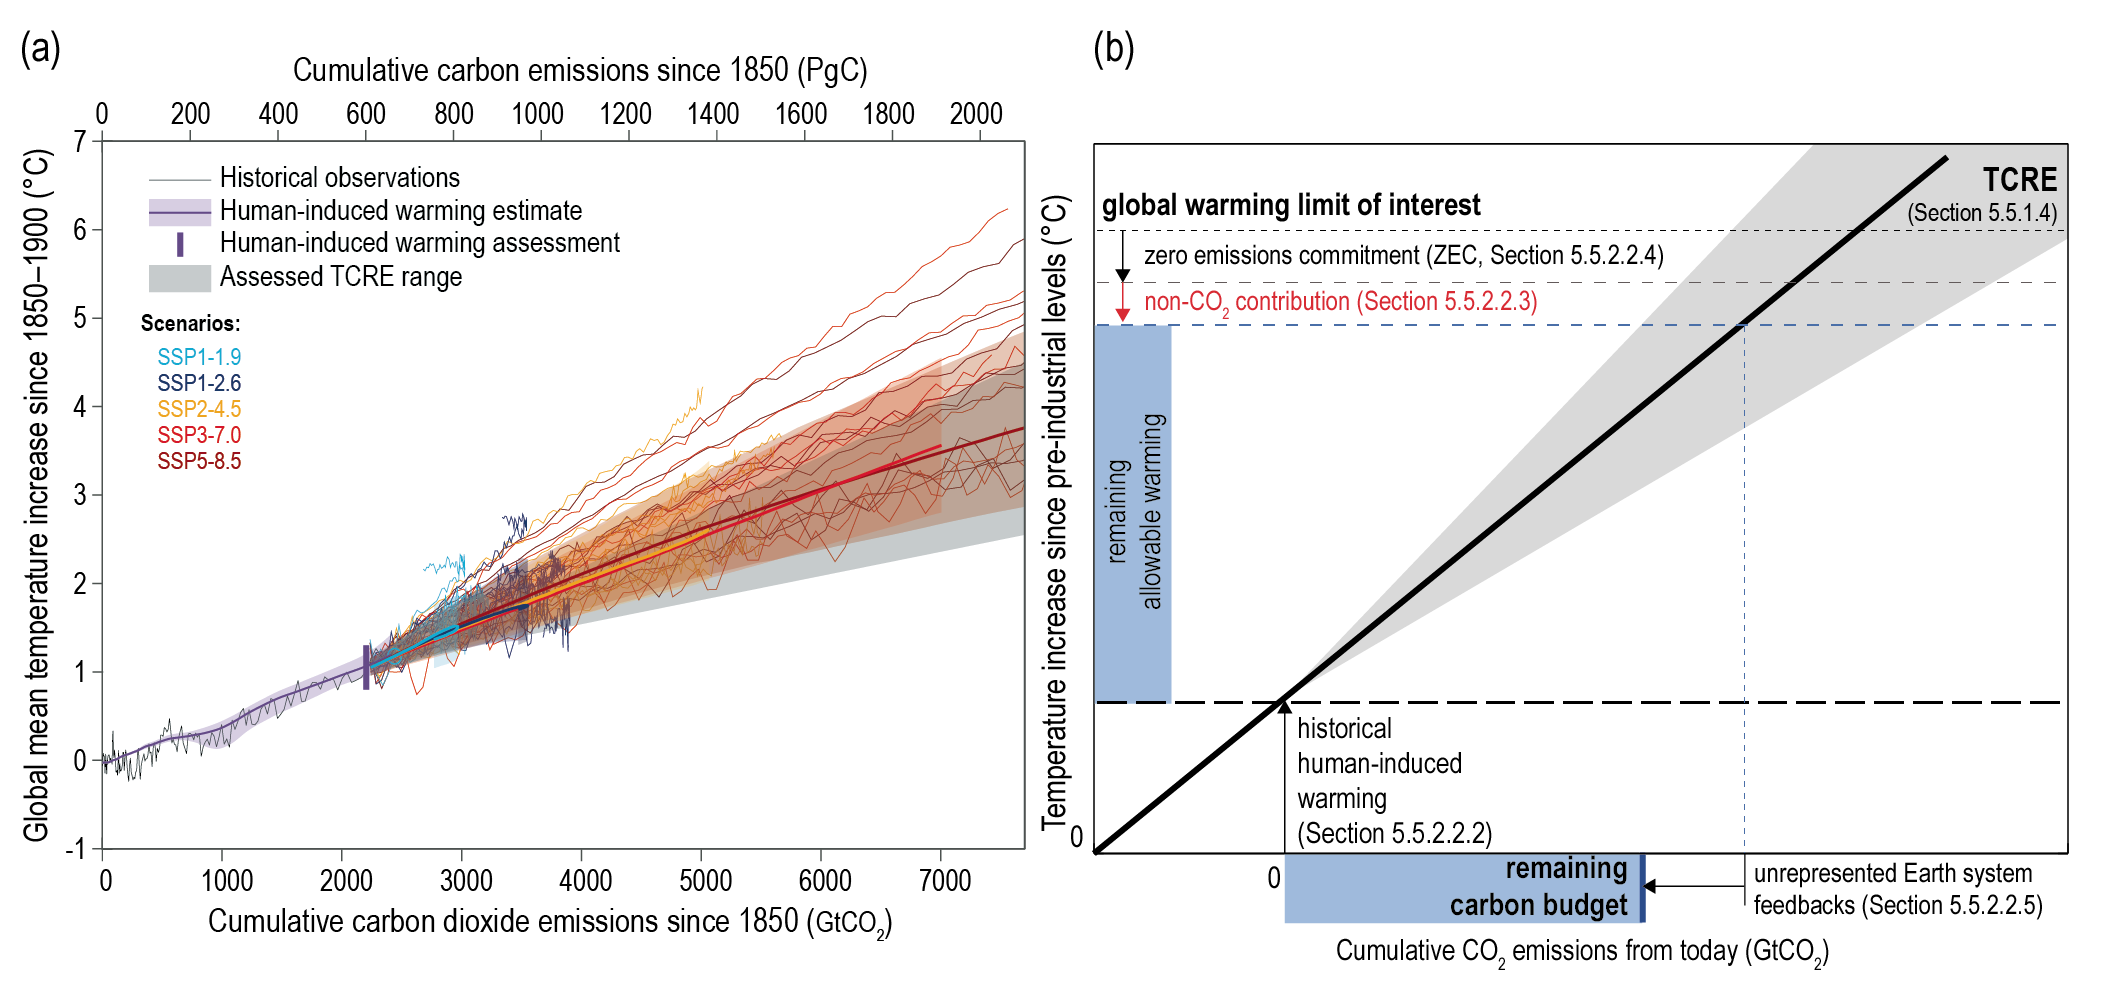
Figure caption
Figure TS.18 | Illustration of (a) relationship between cumulative emissions of carbon dioxide (CO2) and global mean surface air temperature increase and (b) the assessment of the remaining carbon budget from its constituting components based on multiple lines of evidence. The intent of this figure is to show (i) the proportionality between cumulative CO2 emissions and global surface air temperature in observations and models as well as the assessed range of the transient climate response to cumulative CO2 emissions (TCRE), and (ii) how information is combined to derive remaining carbon budgets consistent with limiting warming to a specific level. Carbon budgets consistent with various levels of additional warming are provided in Table 5.8 and should not be read from the illustrations in either panel. In panel (a) thin black line shows historical CO2 emissions together with the assessed global surface temperature increase from 1850–1900 as assessed in Chapter 2 (Box 2.3). The orange-brown range with its central line shows the estimated human-induced share of historical warming. The vertical orange-brown line shows the assessed range of historical human-induced warming for the 2010–2019 period relative to 1850–1900 (Chapter 3). The grey cone shows the assessed likely range for the TCRE (Section 5.5.1.4), starting from 2015. Thin coloured lines show Coupled Model Intercomparison Project Phase 6 (CMIP6) simulations for the five scenarios of the WGI core set (SSP1-1.9, light blue; SSP1-2.6, blue; SSP2-4.5, yellow; SSP3-7.0, red; SSP5-8.5, maroon), starting from 2015 and until 2100. Diagnosed carbon emissions are complemented with estimated land-use change emissions for each respective scenario. Coloured areas show the Chapter 4 assessed very likely range of global surface temperature projections and thick coloured central lines show the median estimate, for each respective scenario. These temperature projections are expressed relative to cumulative CO2 emissions that are available for emissions-driven CMIP6 ScenarioMIP experiments for each respective scenario. For panel (b), the remaining allowable warming is estimated by combining the global warming limit of interest with the assessed historical human-induced warming (Section 5.5.2.2.2), the assessed future potential non-CO2 warming contribution (Section 5.5.2.2.3) and the zero emissions commitment (ZEC; Section 5.5.2.2.4). The remaining allowable warming (vertical blue bar) is subsequently combined with the assessed TCRE (Sections 5.5.1.4 and 5.5.2.2.1) and contribution of unrepresented Earth system feedbacks (Section 5.5.2.2.5) to provide an assessed estimate of the remaining carbon budget (horizontal blue bar, Table 5.8). Note that contributions in panel (b) are illustrative and are not to scale. For example, the central ZEC estimate was assessed to be zero. {Box 2.3, 5.2.1, 5.2.2, Figure 5.31}