Back chapter figures
Figure TS.20
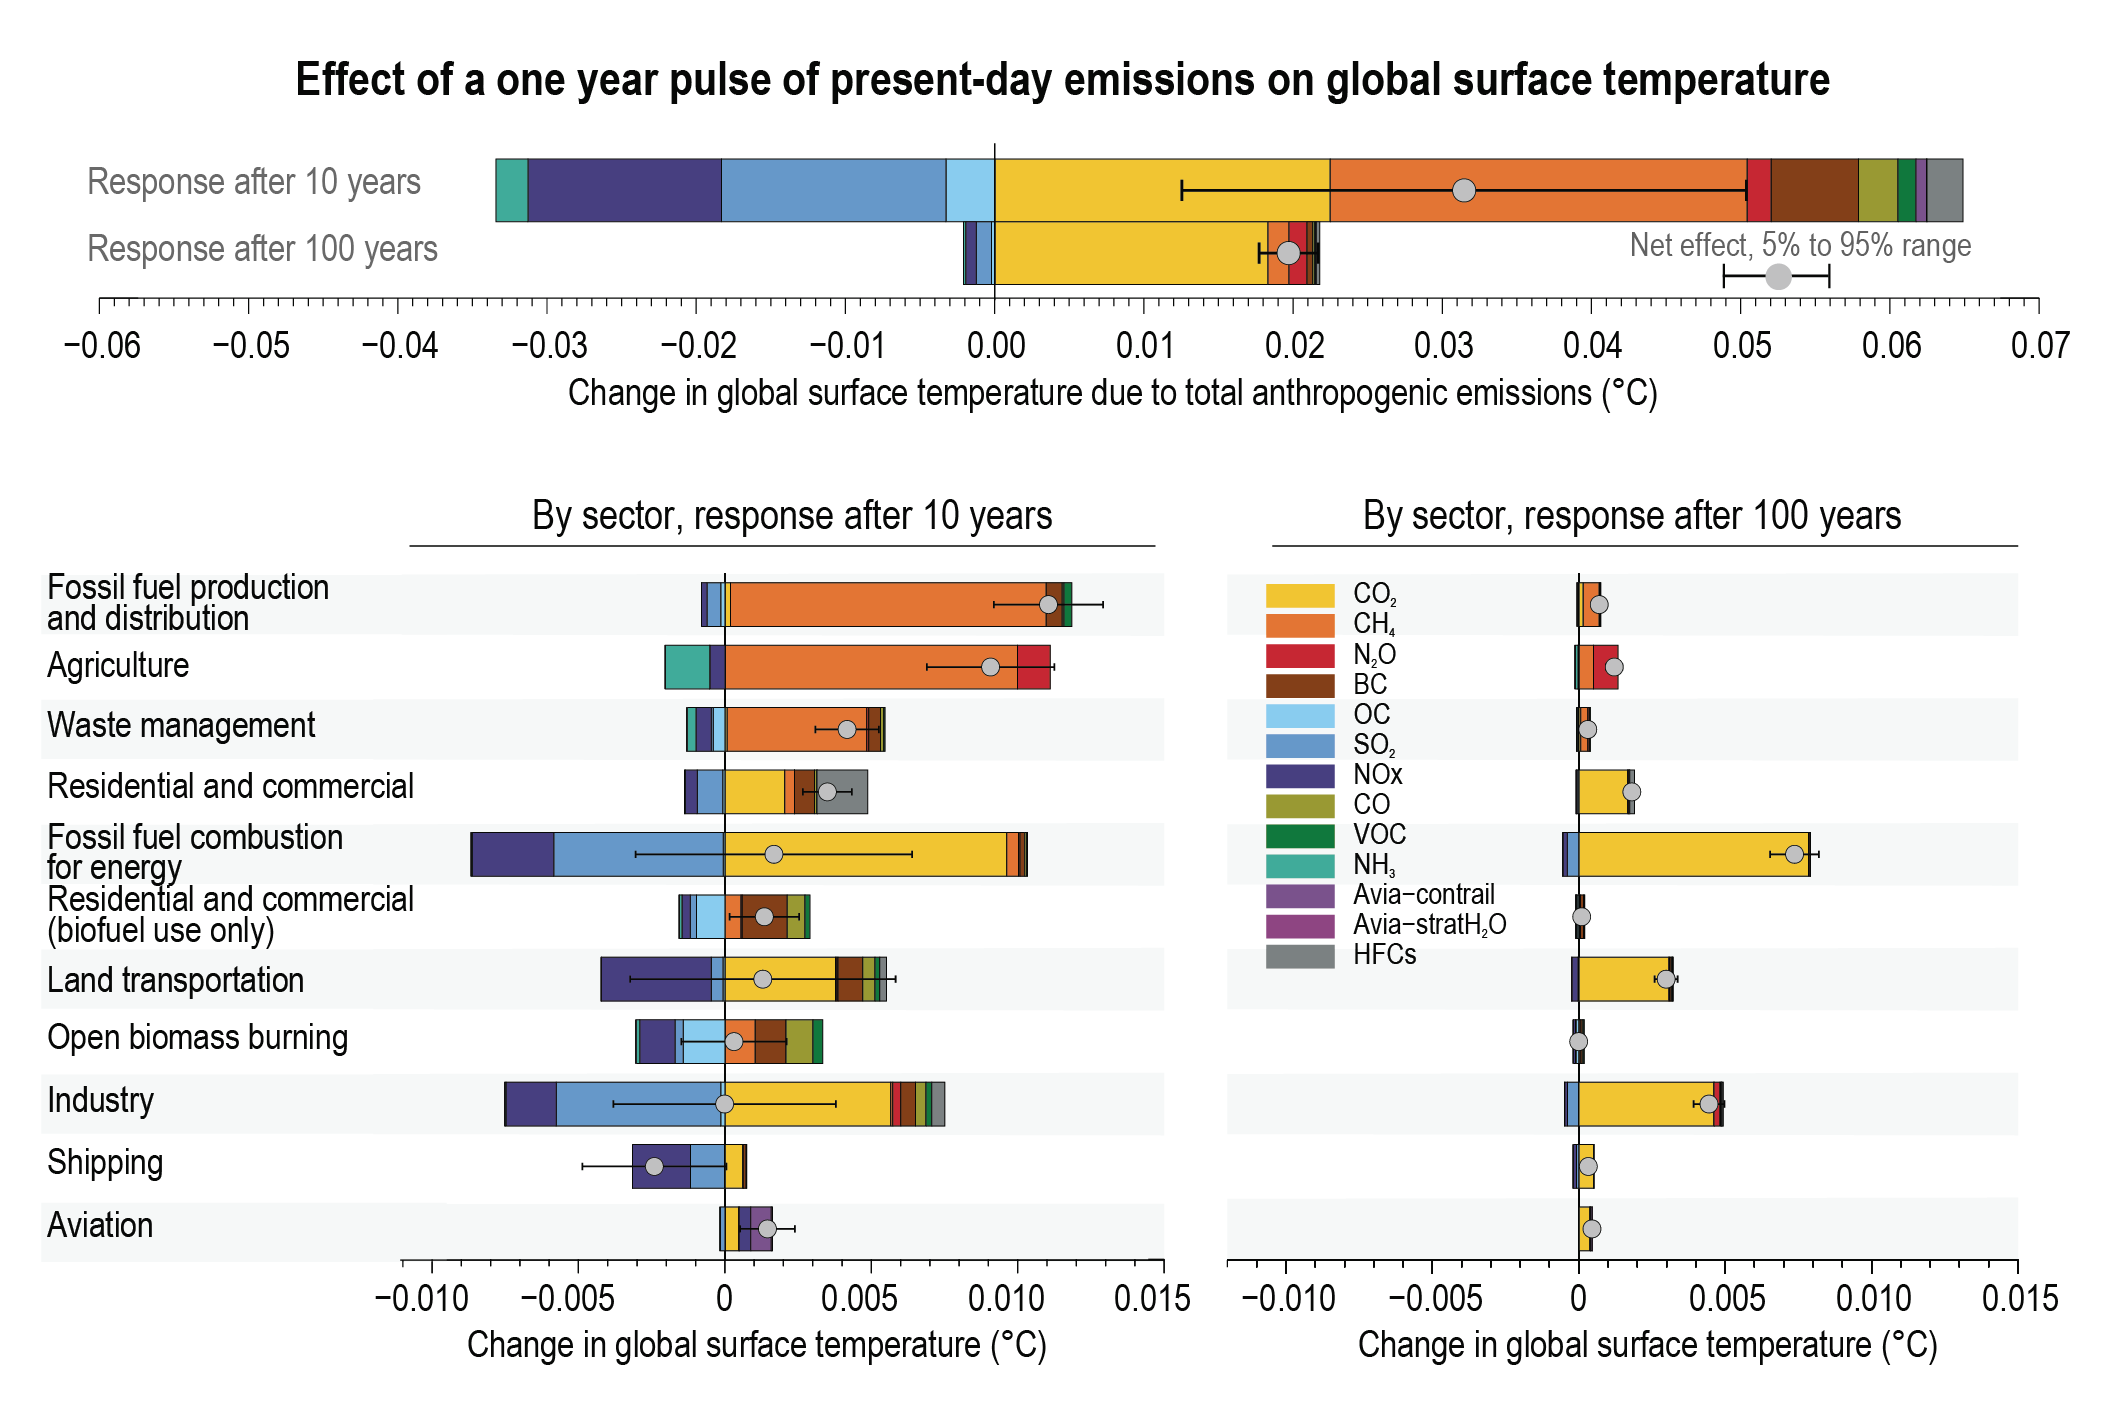
Figure caption
Figure TS.20 | Global surface temperature change 10 and 100 years after a one-year pulse of present-day emissions. The intent of this figure is to show the sectoral contribution to present-day climate change by specific climate forcers, including carbon dioxide (CO2 ) as well as short-lived climate forcers (SLCFs). The temperature response is broken down by individual species and shown for total anthropogenic emissions(top), and sectoral emissions on 10-year (left) and 100-year time scales (right). Sectors are sorted by (high-to-low) net temperature effect on the 10-year time scale. Error bars in the top panel show the 5–95% range in net temperature effect due to uncertainty in radiative forcing only (calculated using a Monte Carlo approach and best estimate uncertainties from the literature). Emissions for 2014 are from the Coupled Model Intercomparison Project Phase 6 (CMIP6) emissions dataset, except for hydrofluorocarbons (HFCs) and aviation H2O, which rely on other datasets (see Section 6.6.2 for more details). CO2 emissions are excluded from open biomass burning and residential biofuel use. {6.6.2, Figure 6.16}