Back chapter figures
Figure TS.7
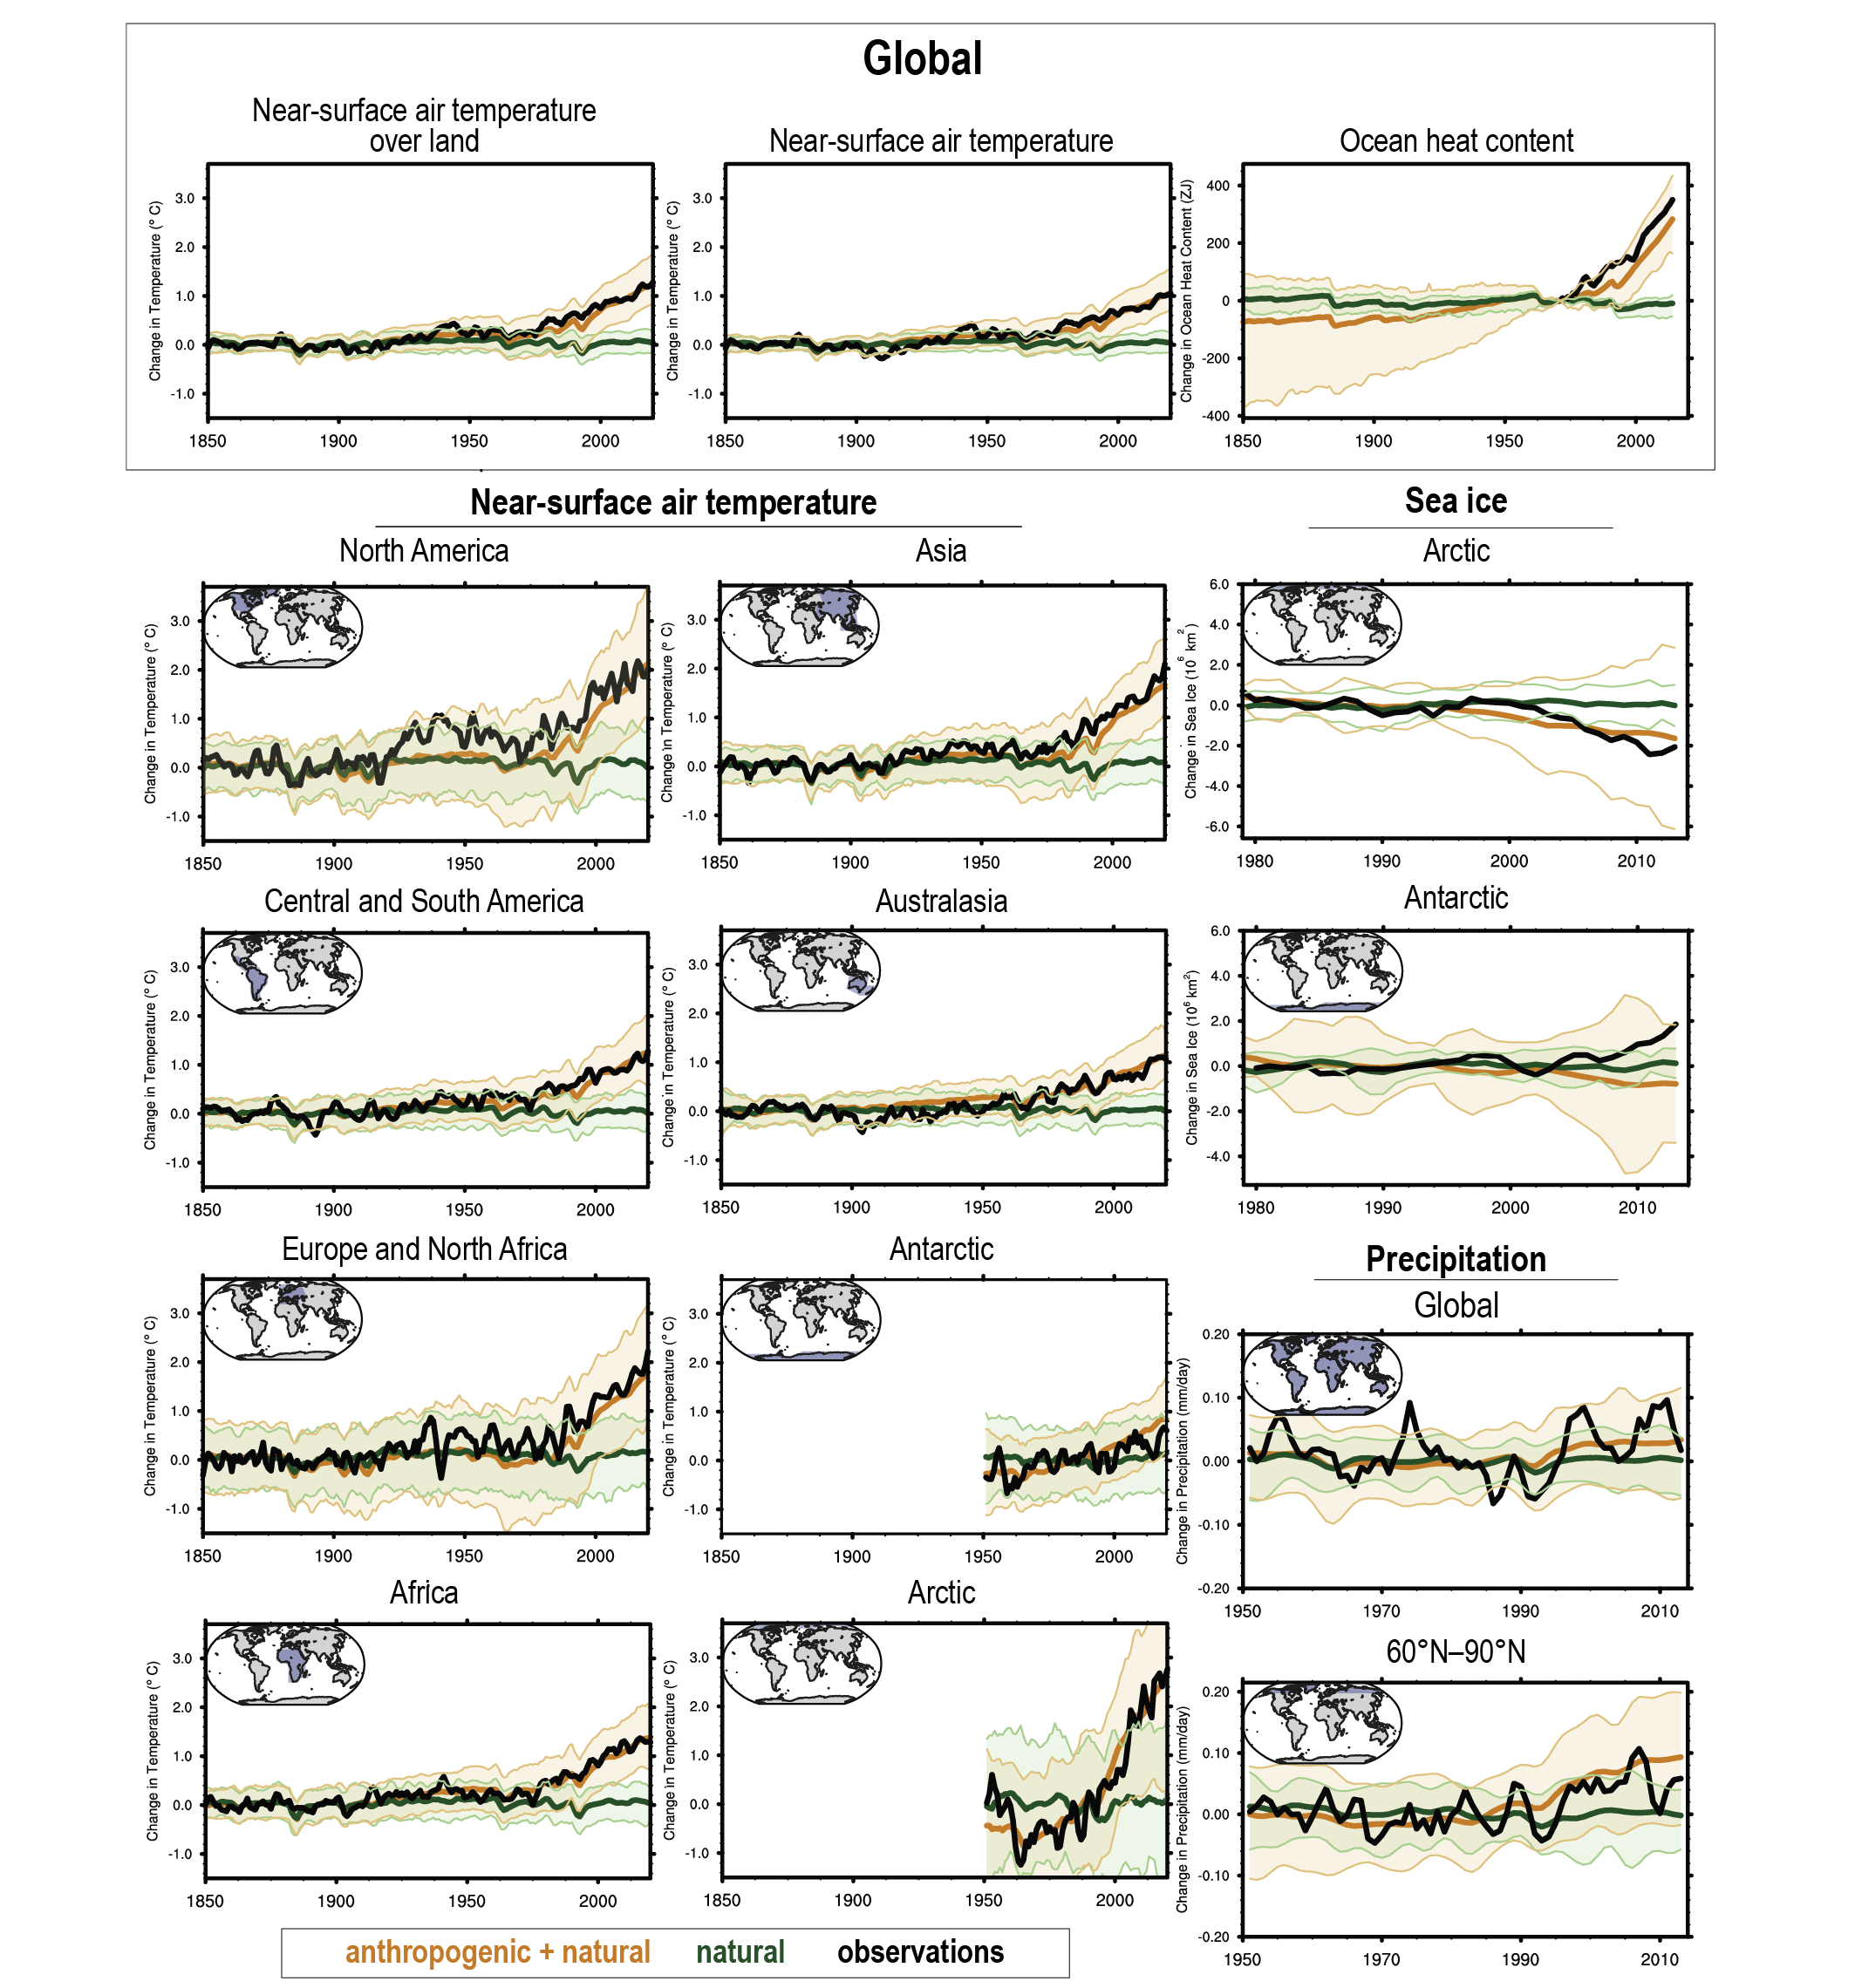
Figure caption
Figure TS.7 | Simulated and observed changes compared to the 1850–1900 average in key large-scale indicators of climate change across the climate system, for continents, ocean basins and globally up to 2014. The intent of this figure is to compare the observed and simulated changes over the historical period for a range of variables and regions, with and without anthropogenic forcings, for attribution. Black lines show observations, orange lines and shading show the multi-model mean and 5–95th percentile ranges for Coupled Model Intercomparison Project Phase 6 (CMIP6) historical simulations including anthropogenic and natural forcing, and green lines and shading show corresponding ensemble means and 5–95th percentile ranges for CMIP6 natural-only simulations. Observations after 2014 (including, for example, a strong subsequent decrease of Antarctic sea ice area that leads to no significant overall trend since 1979) are not shown because the CMIP6 historical simulations end in 2014. A 3-year running mean smoothing has been applied to all observational time series. {3.8, Figure 3.41}