Figure Cross-Chapter Box CLIMATE.1
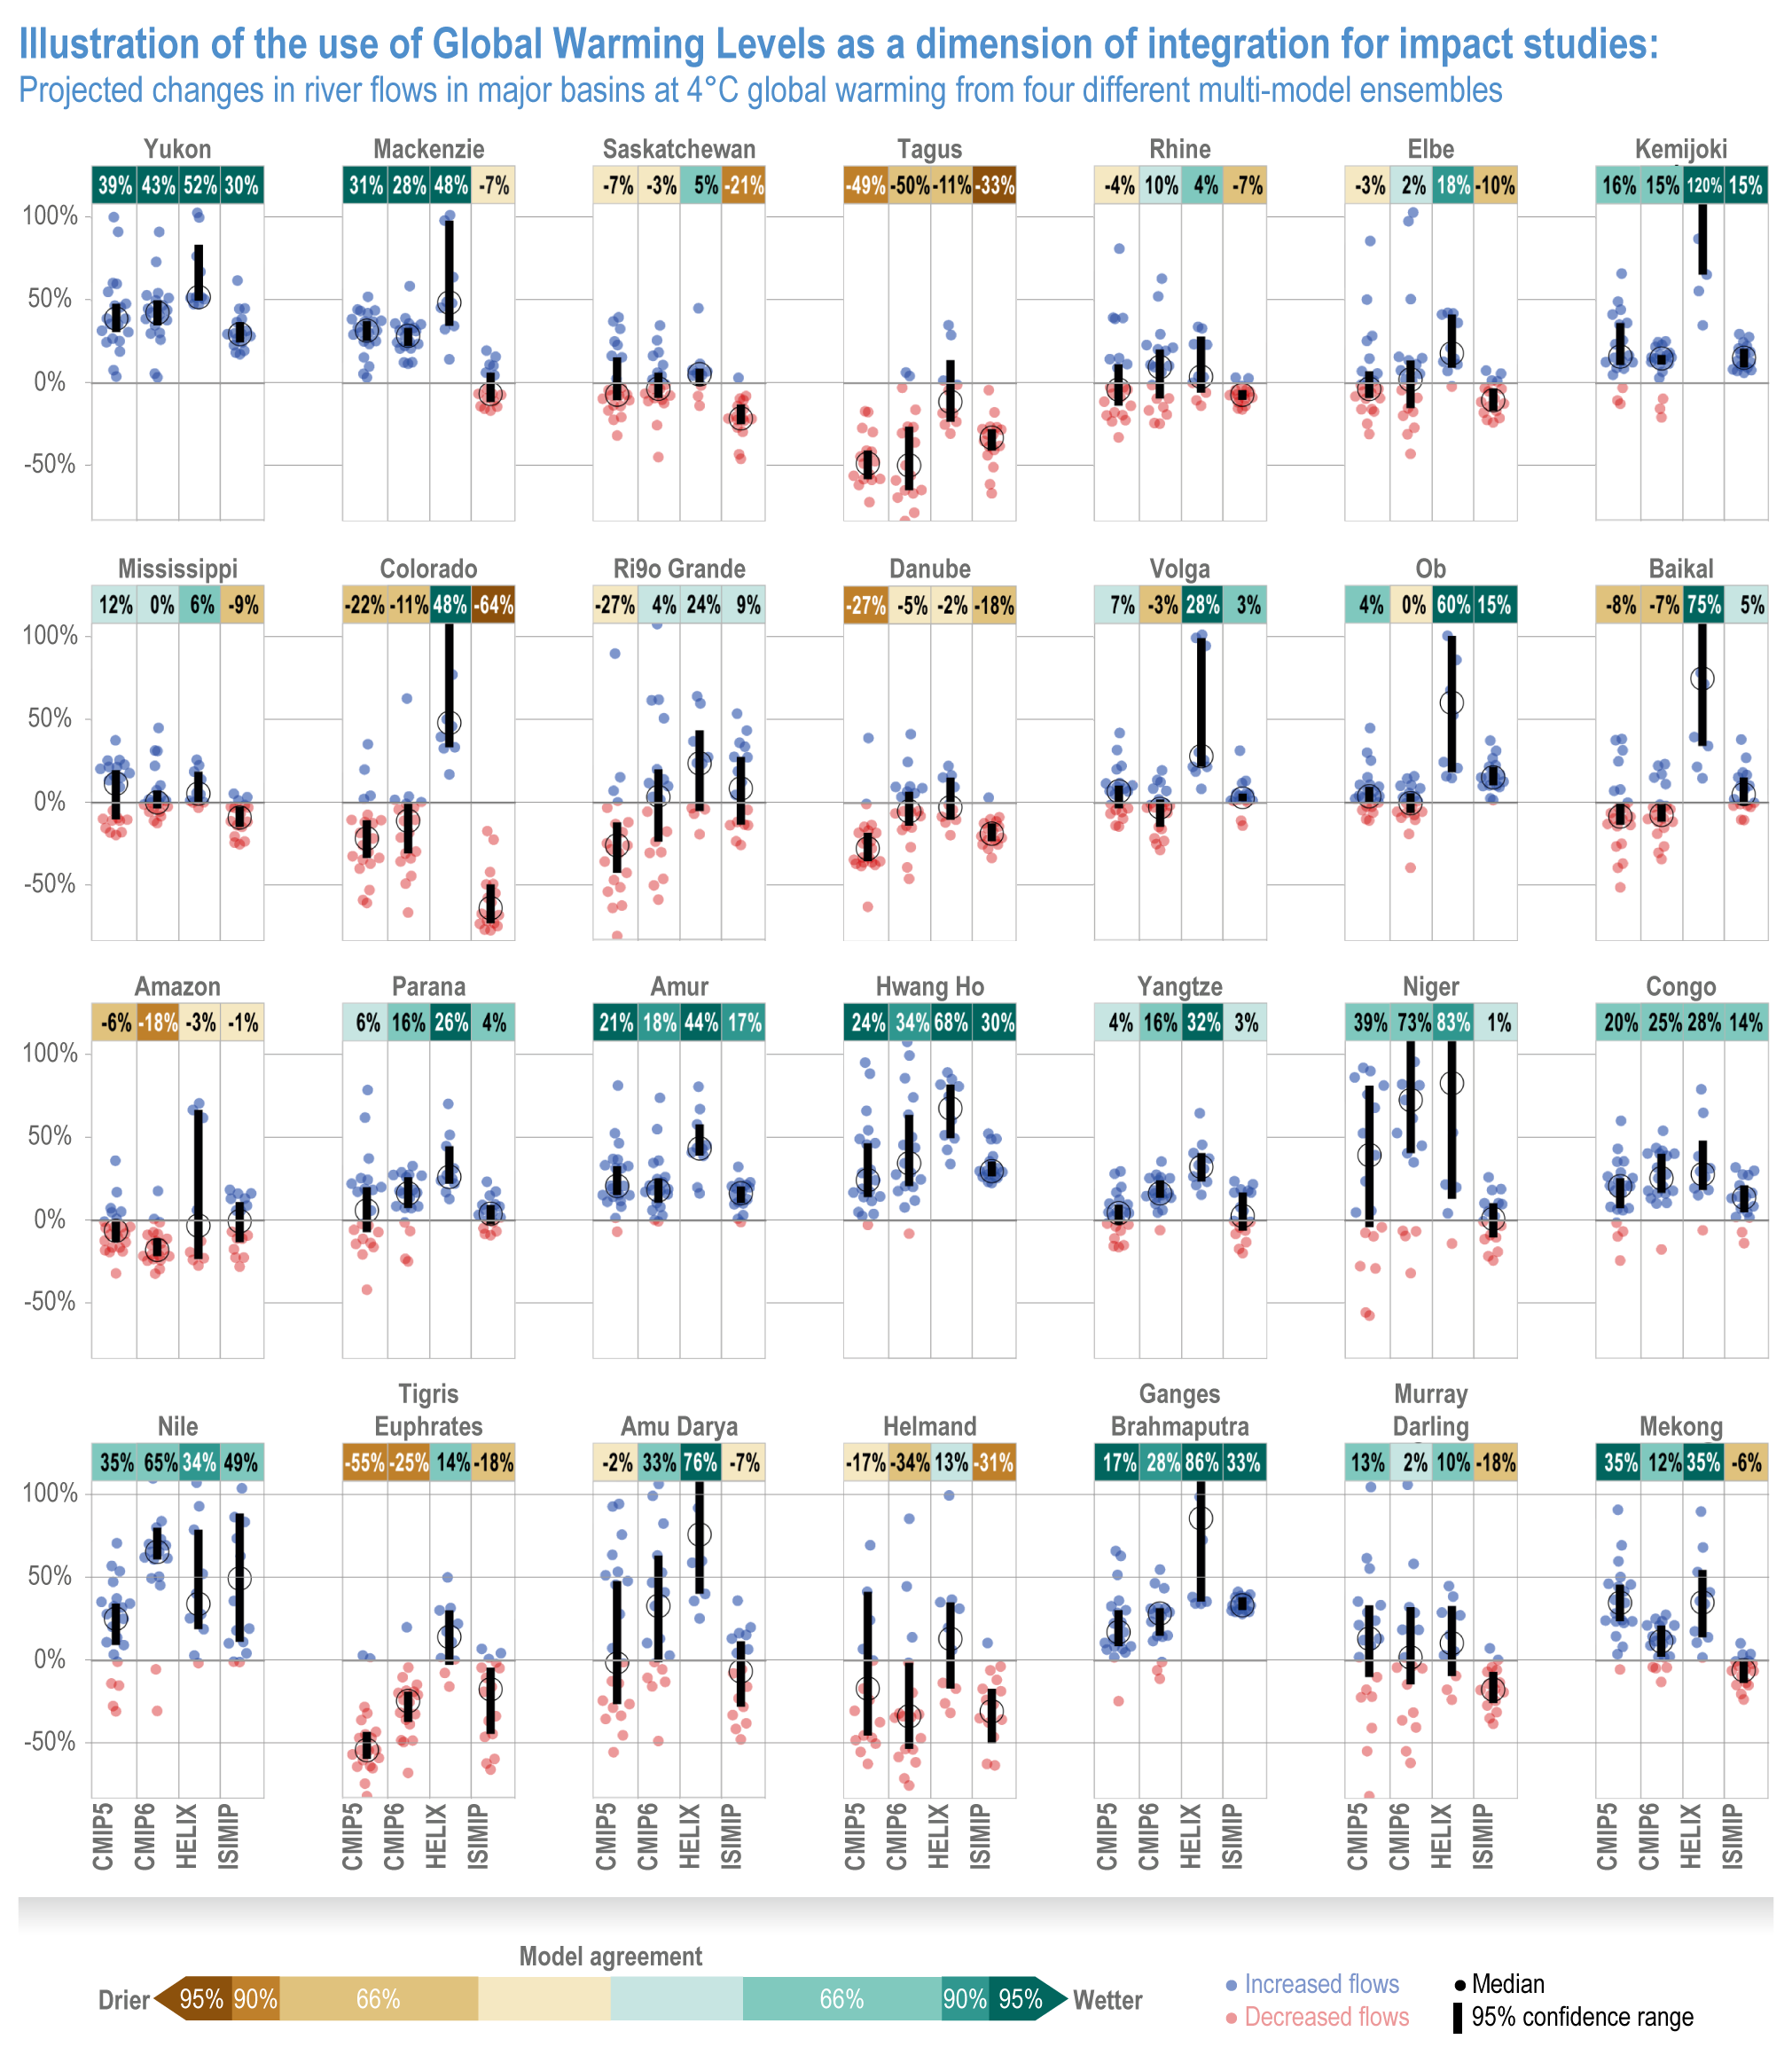
Figure caption
Figure Cross-Chapter Box CLIMATE.1 | Illustration of the use of global warming levels (GWLs) as a dimension of integration for impact studies: projected changes in river flows in major basins at 4°C global warming from four different multi-model ensembles. Results are shown for projected flow changes direct from Earth System Models (ESMs) in CMIP5 and CMIP6, for the Joint UK Land Environment Simulator (JULES) land surface model driven by meteorological outputs of the HadGEM3 and EC-Earth model in the High-End cLimate Impacts and eXtremes (HELIX) ensemble (Betts et al., 2018; Koutroulis et al., 2019), and nine hydrological models driven by a subset of five CMIP5 ESMs in the Inter-Sectoral Impacts Model Intercomparison Project (ISIMIP; Warszawski et al., 2014). Dots show results from individual models, blue for increased flows and red for decreased flows, black circles show the median for each ensemble, and black bars show the 95% confidence range in the median. See Figure 4.11 for further details.