Back chapter figures
Figure Cross-Chapter Box PALEO.1
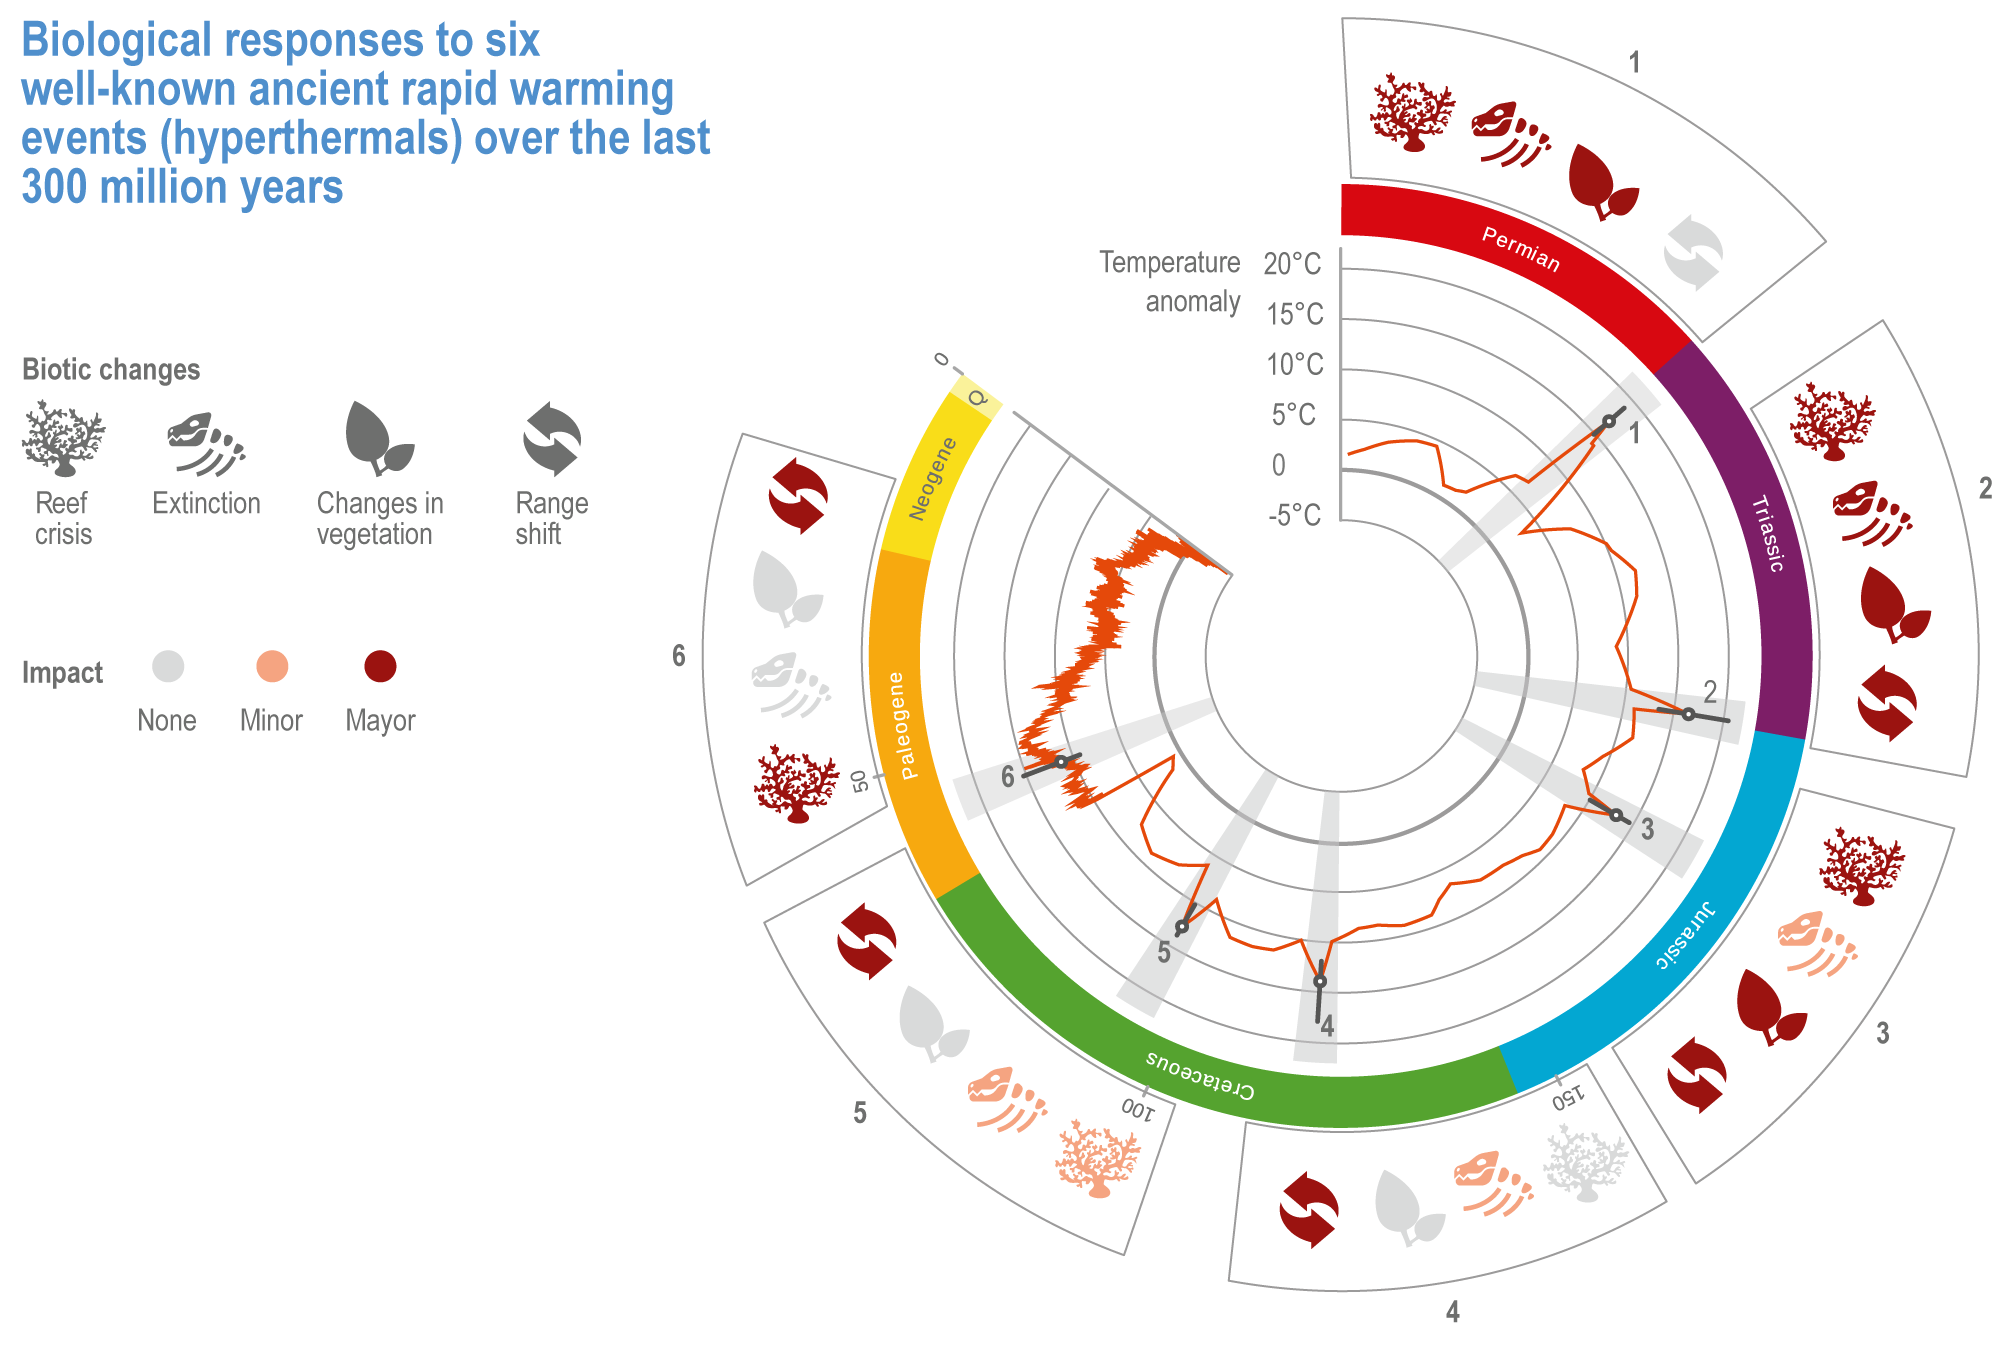
Figure caption
Figure Cross-Chapter Box PALEO.1 | Biological responses to six well-known ancient rapid warming events (hyperthermals) over the last 300 million years. Temperature anomalies (mean temperature difference to pre-industrial 1850–1900, solid orange curve) derived from climate modelling (300–66 Ma) (Haywood et al., 2019) and deep-sea proxy data (66–0.1 Ma) (Hansen et al., 2013). Temperature peaks underneath the grey bars indicate well-known hyperthermals with temperature anomalies derived from temperature-sensitive proxy data (Foster et al., 2018). Error bars indicate uncertainties in peak warming events (ranges in the literature). Insets show observed impacts to the biosphere. Q, Quaternary.