Back chapter figures
Figure 11.2
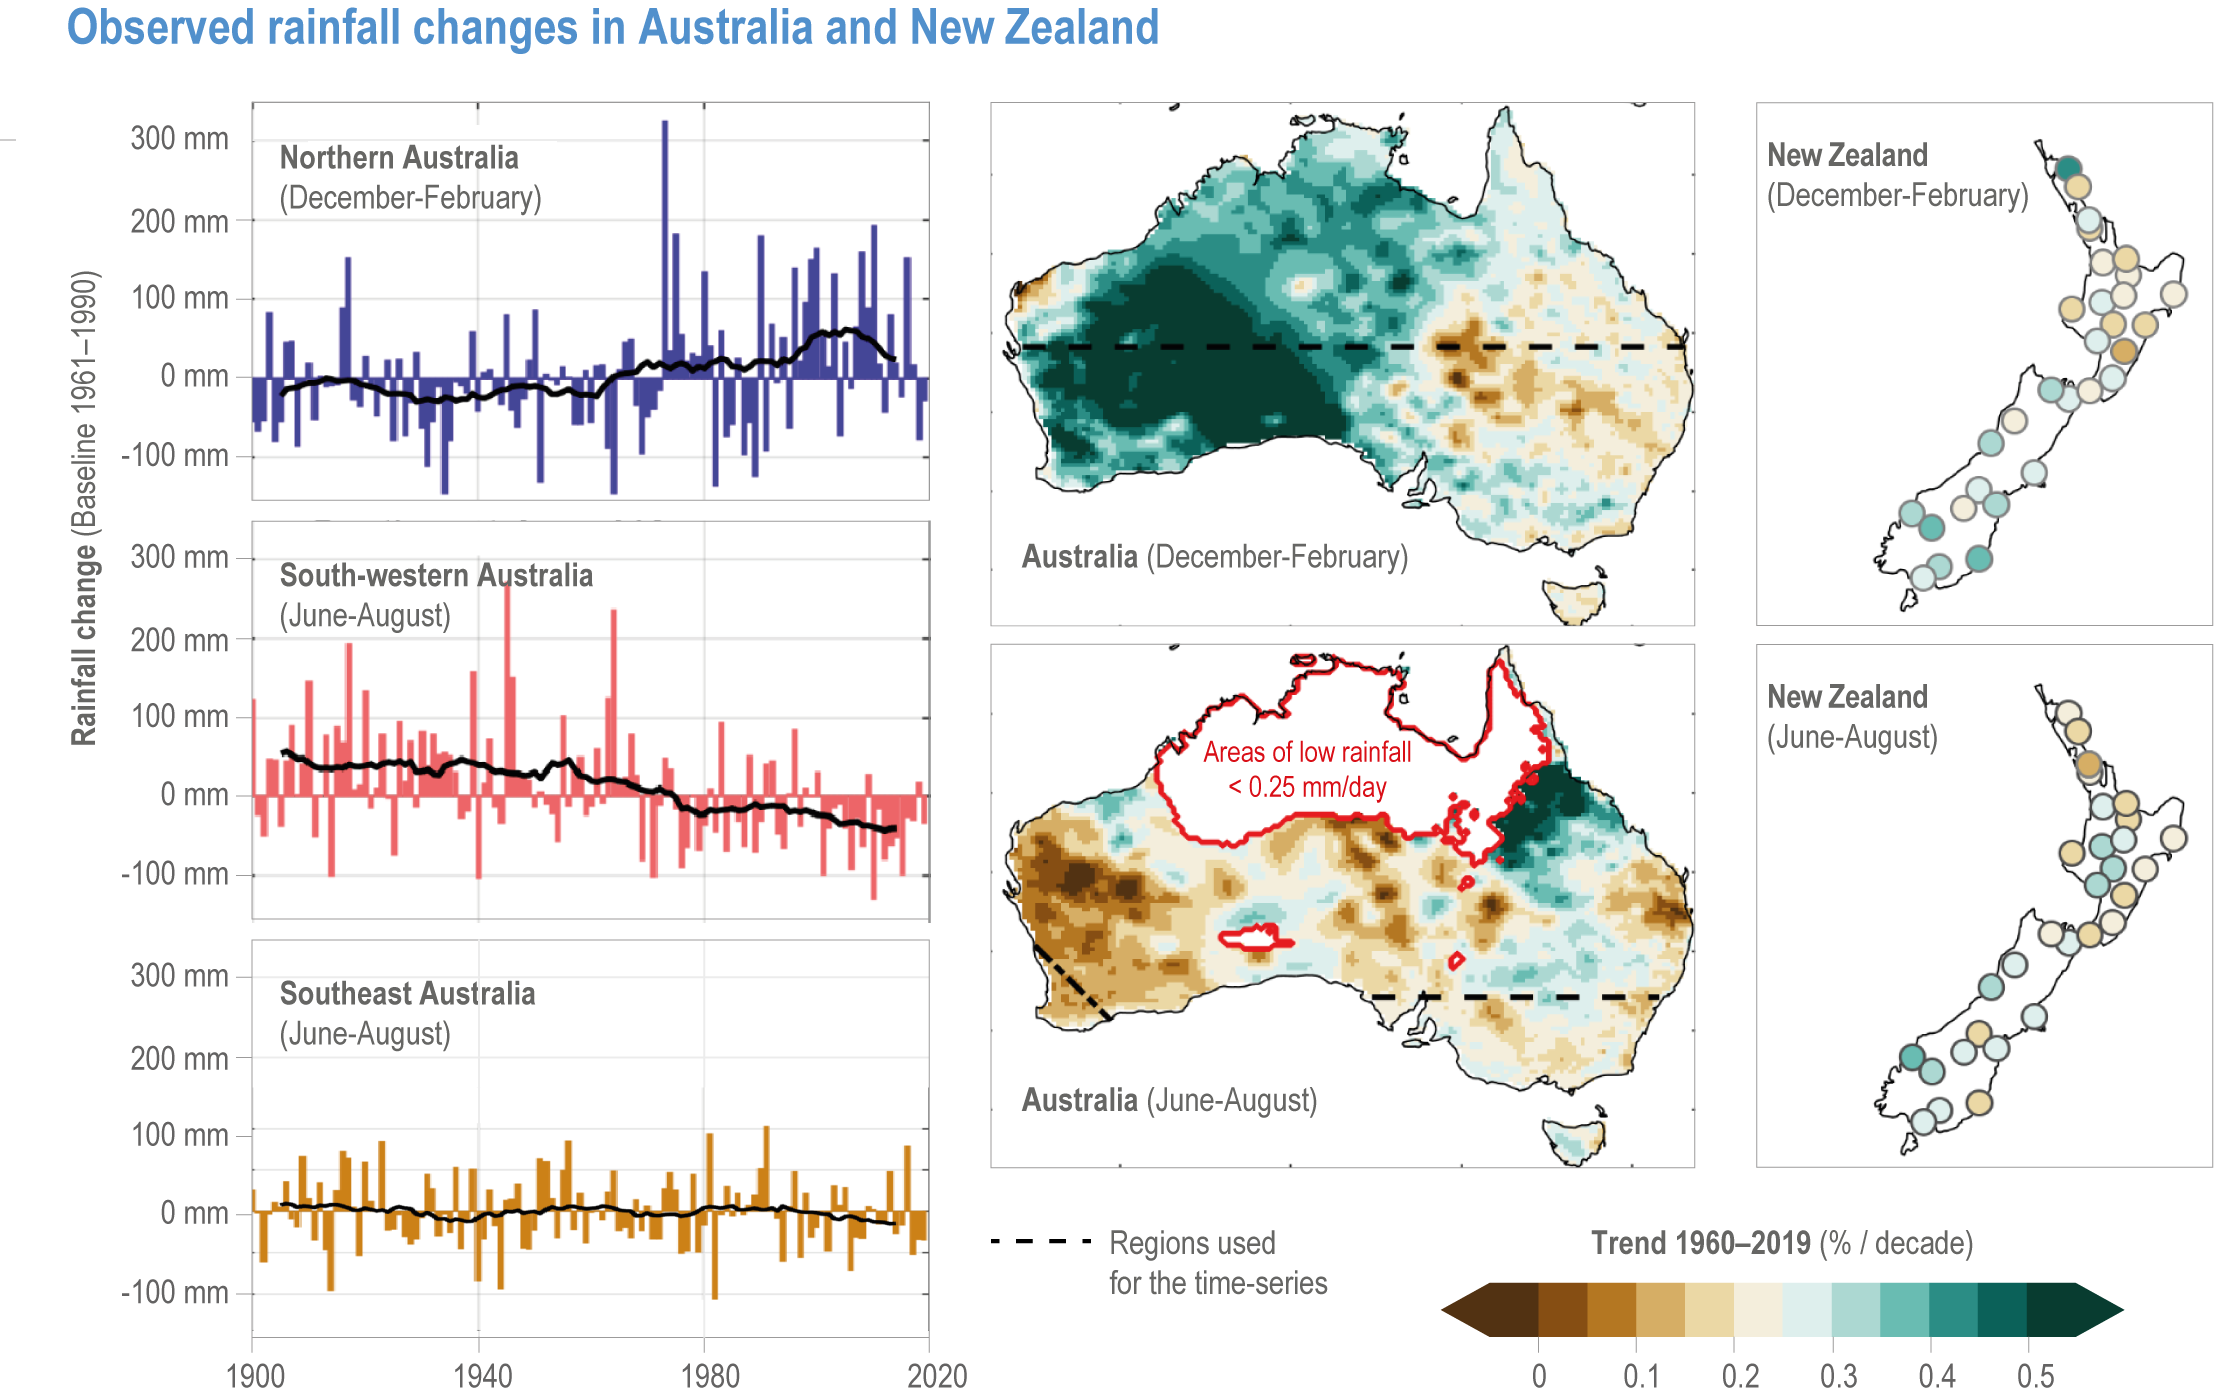
Figure caption
Figure 11.2 | Observed rainfall changes in Australia and New Zealand. Rainfall change time series for 1900–2019 are shown for Northern Australia (December–February: DJF), southwest Australia (June–August: JJA) and southeast Australia (JJA). Dashed lines on the maps for Australia show regions used for the time series. Rainfall trend maps are shown for 1960–2019 (DJF and JJA) using contours for Australia and individual sites for New Zealand. Areas of low Australian rainfall (less than 0.25 mm/day) are shaded white in JJA. Data courtesy of BOM and NIWA.