Back chapter figures
Figure 12.6
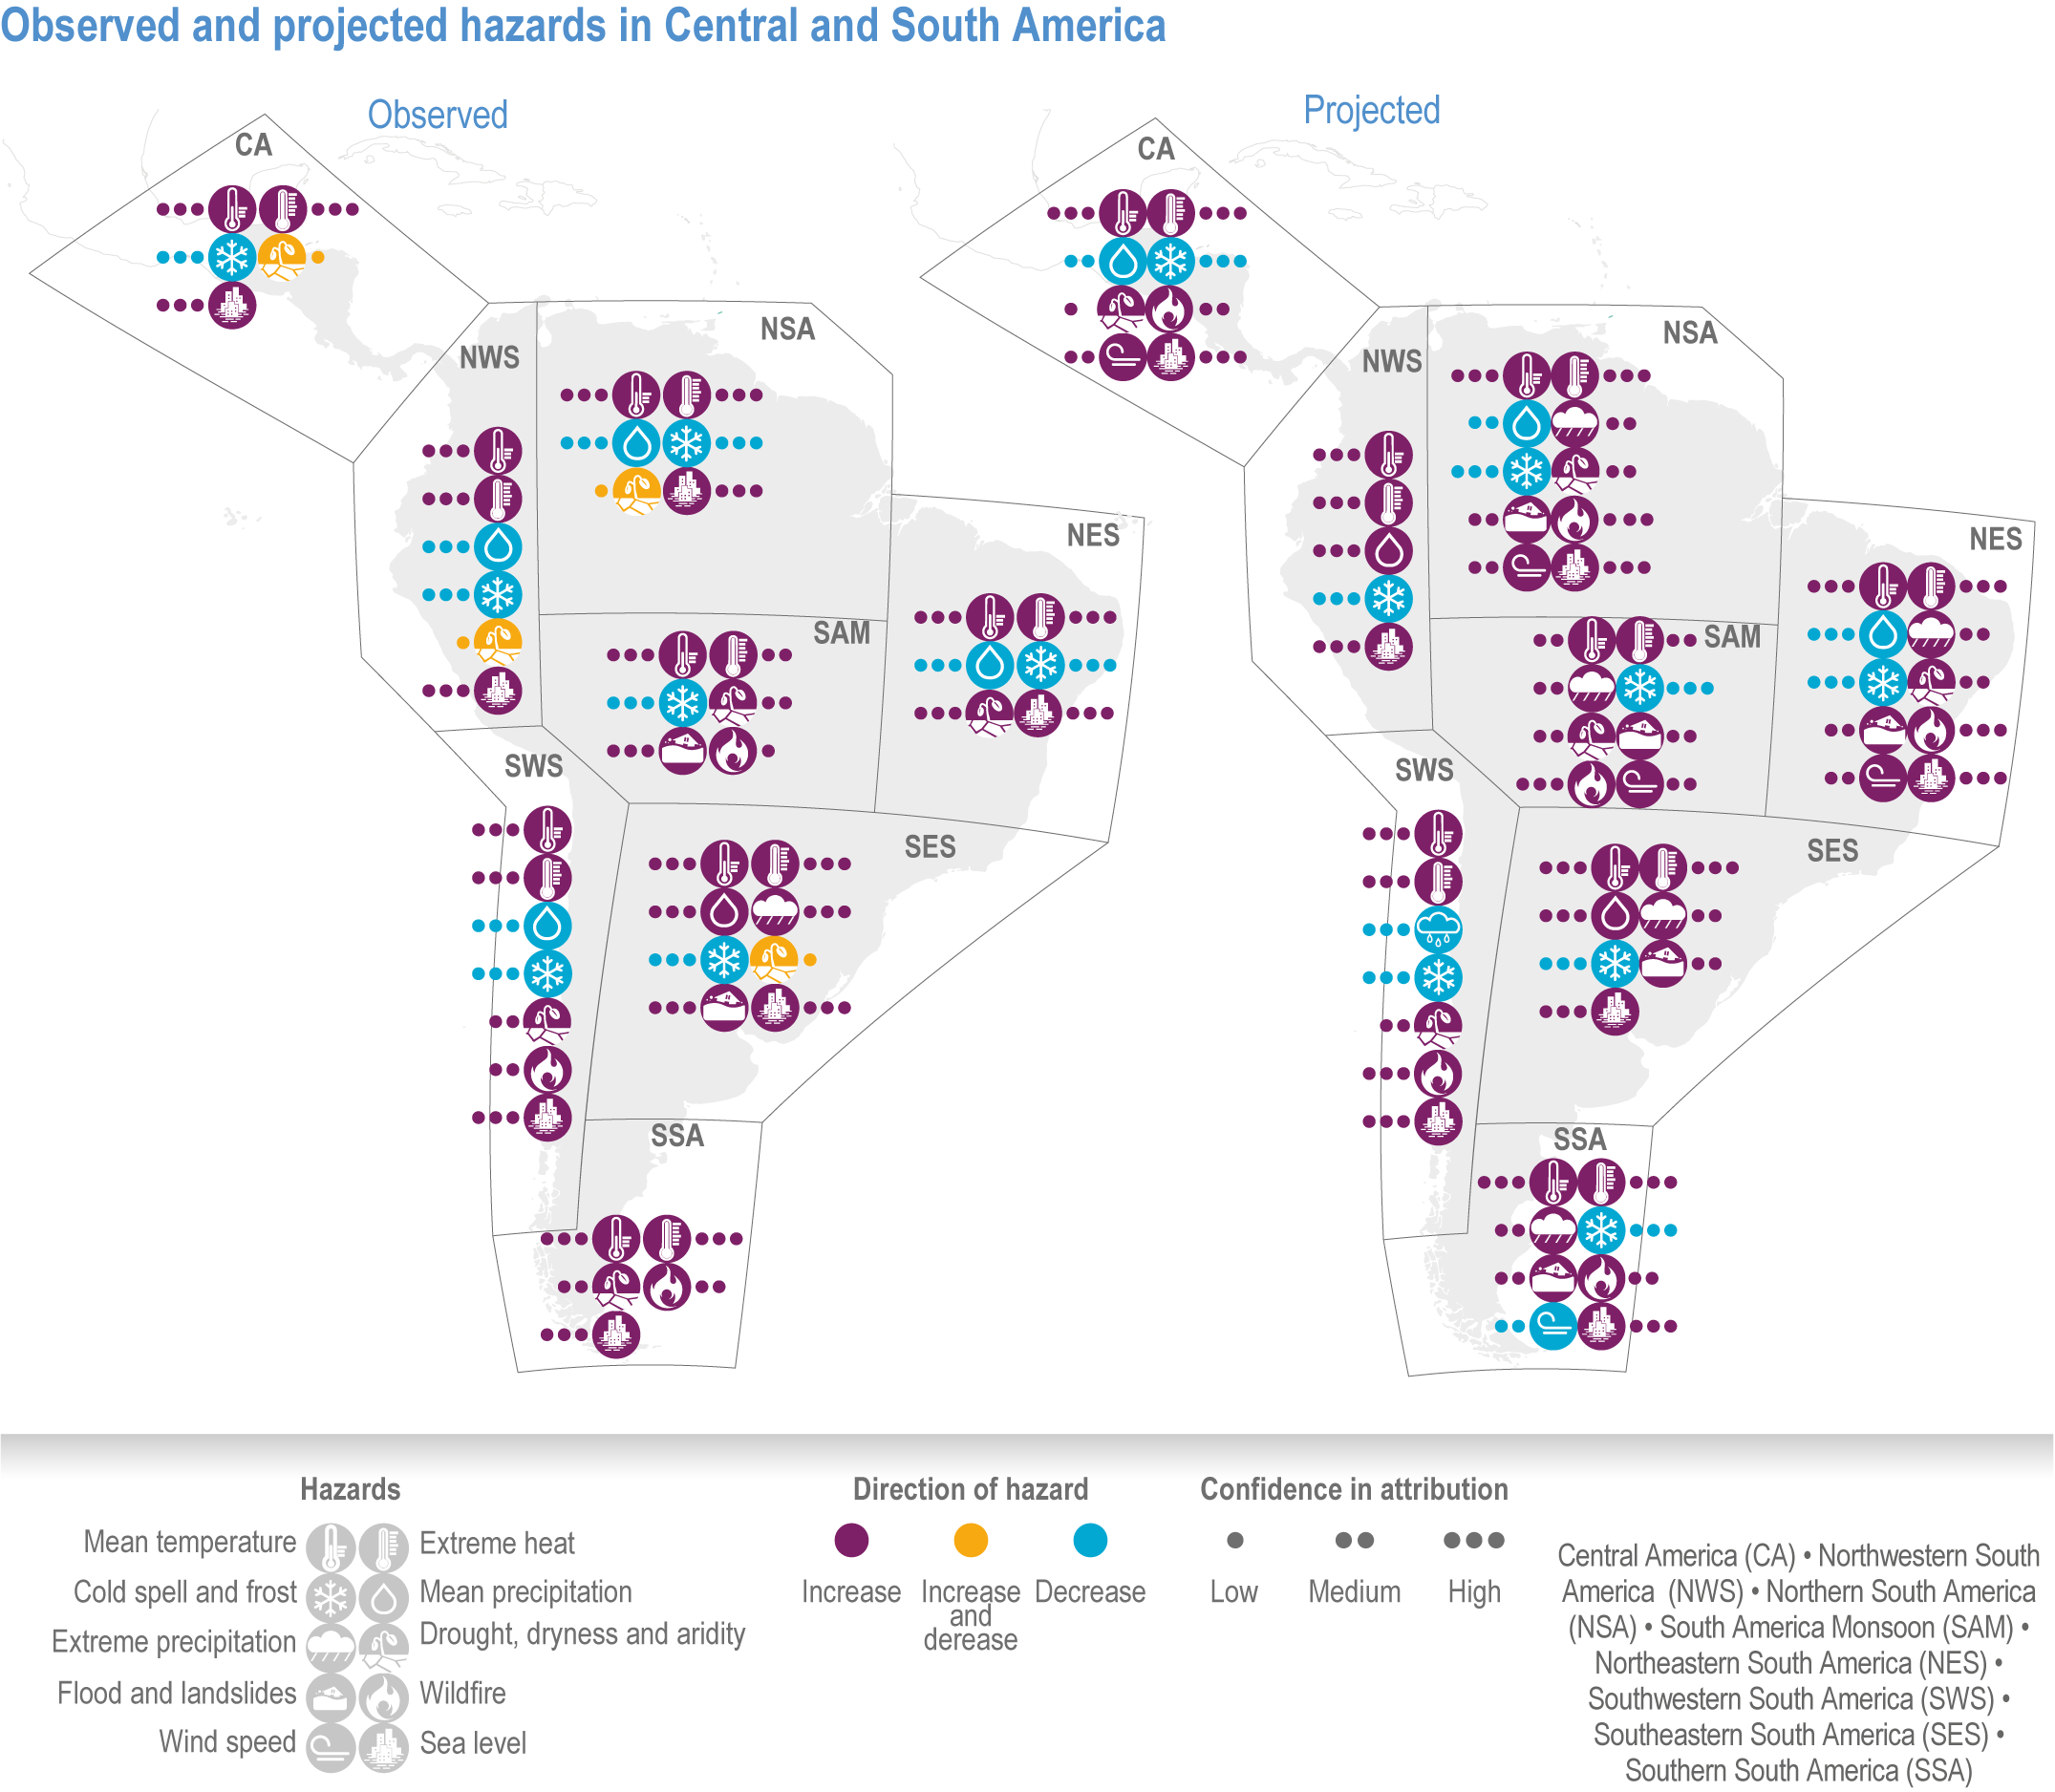
Figure caption
Figure 12.6 | Observed trends (WGI AR6 Tables 11.13, 11.14, 11.15) (Seneviratne et al., 2021) and summary of confidence in direction of projected change in climatic impact drivers, representing their aggregate characteristic changes for mid-century for RCP4.5, SSP3-44 4.5 and SRES A1B scenarios, or above within each AR6 region, approximately corresponding (for CIDs that are independent of SLR) to global warming levels between 2°C and 2.4°C (WGI AR6 Table 12.6) (Ranasinghe et al., 2021).