Figure 12.13
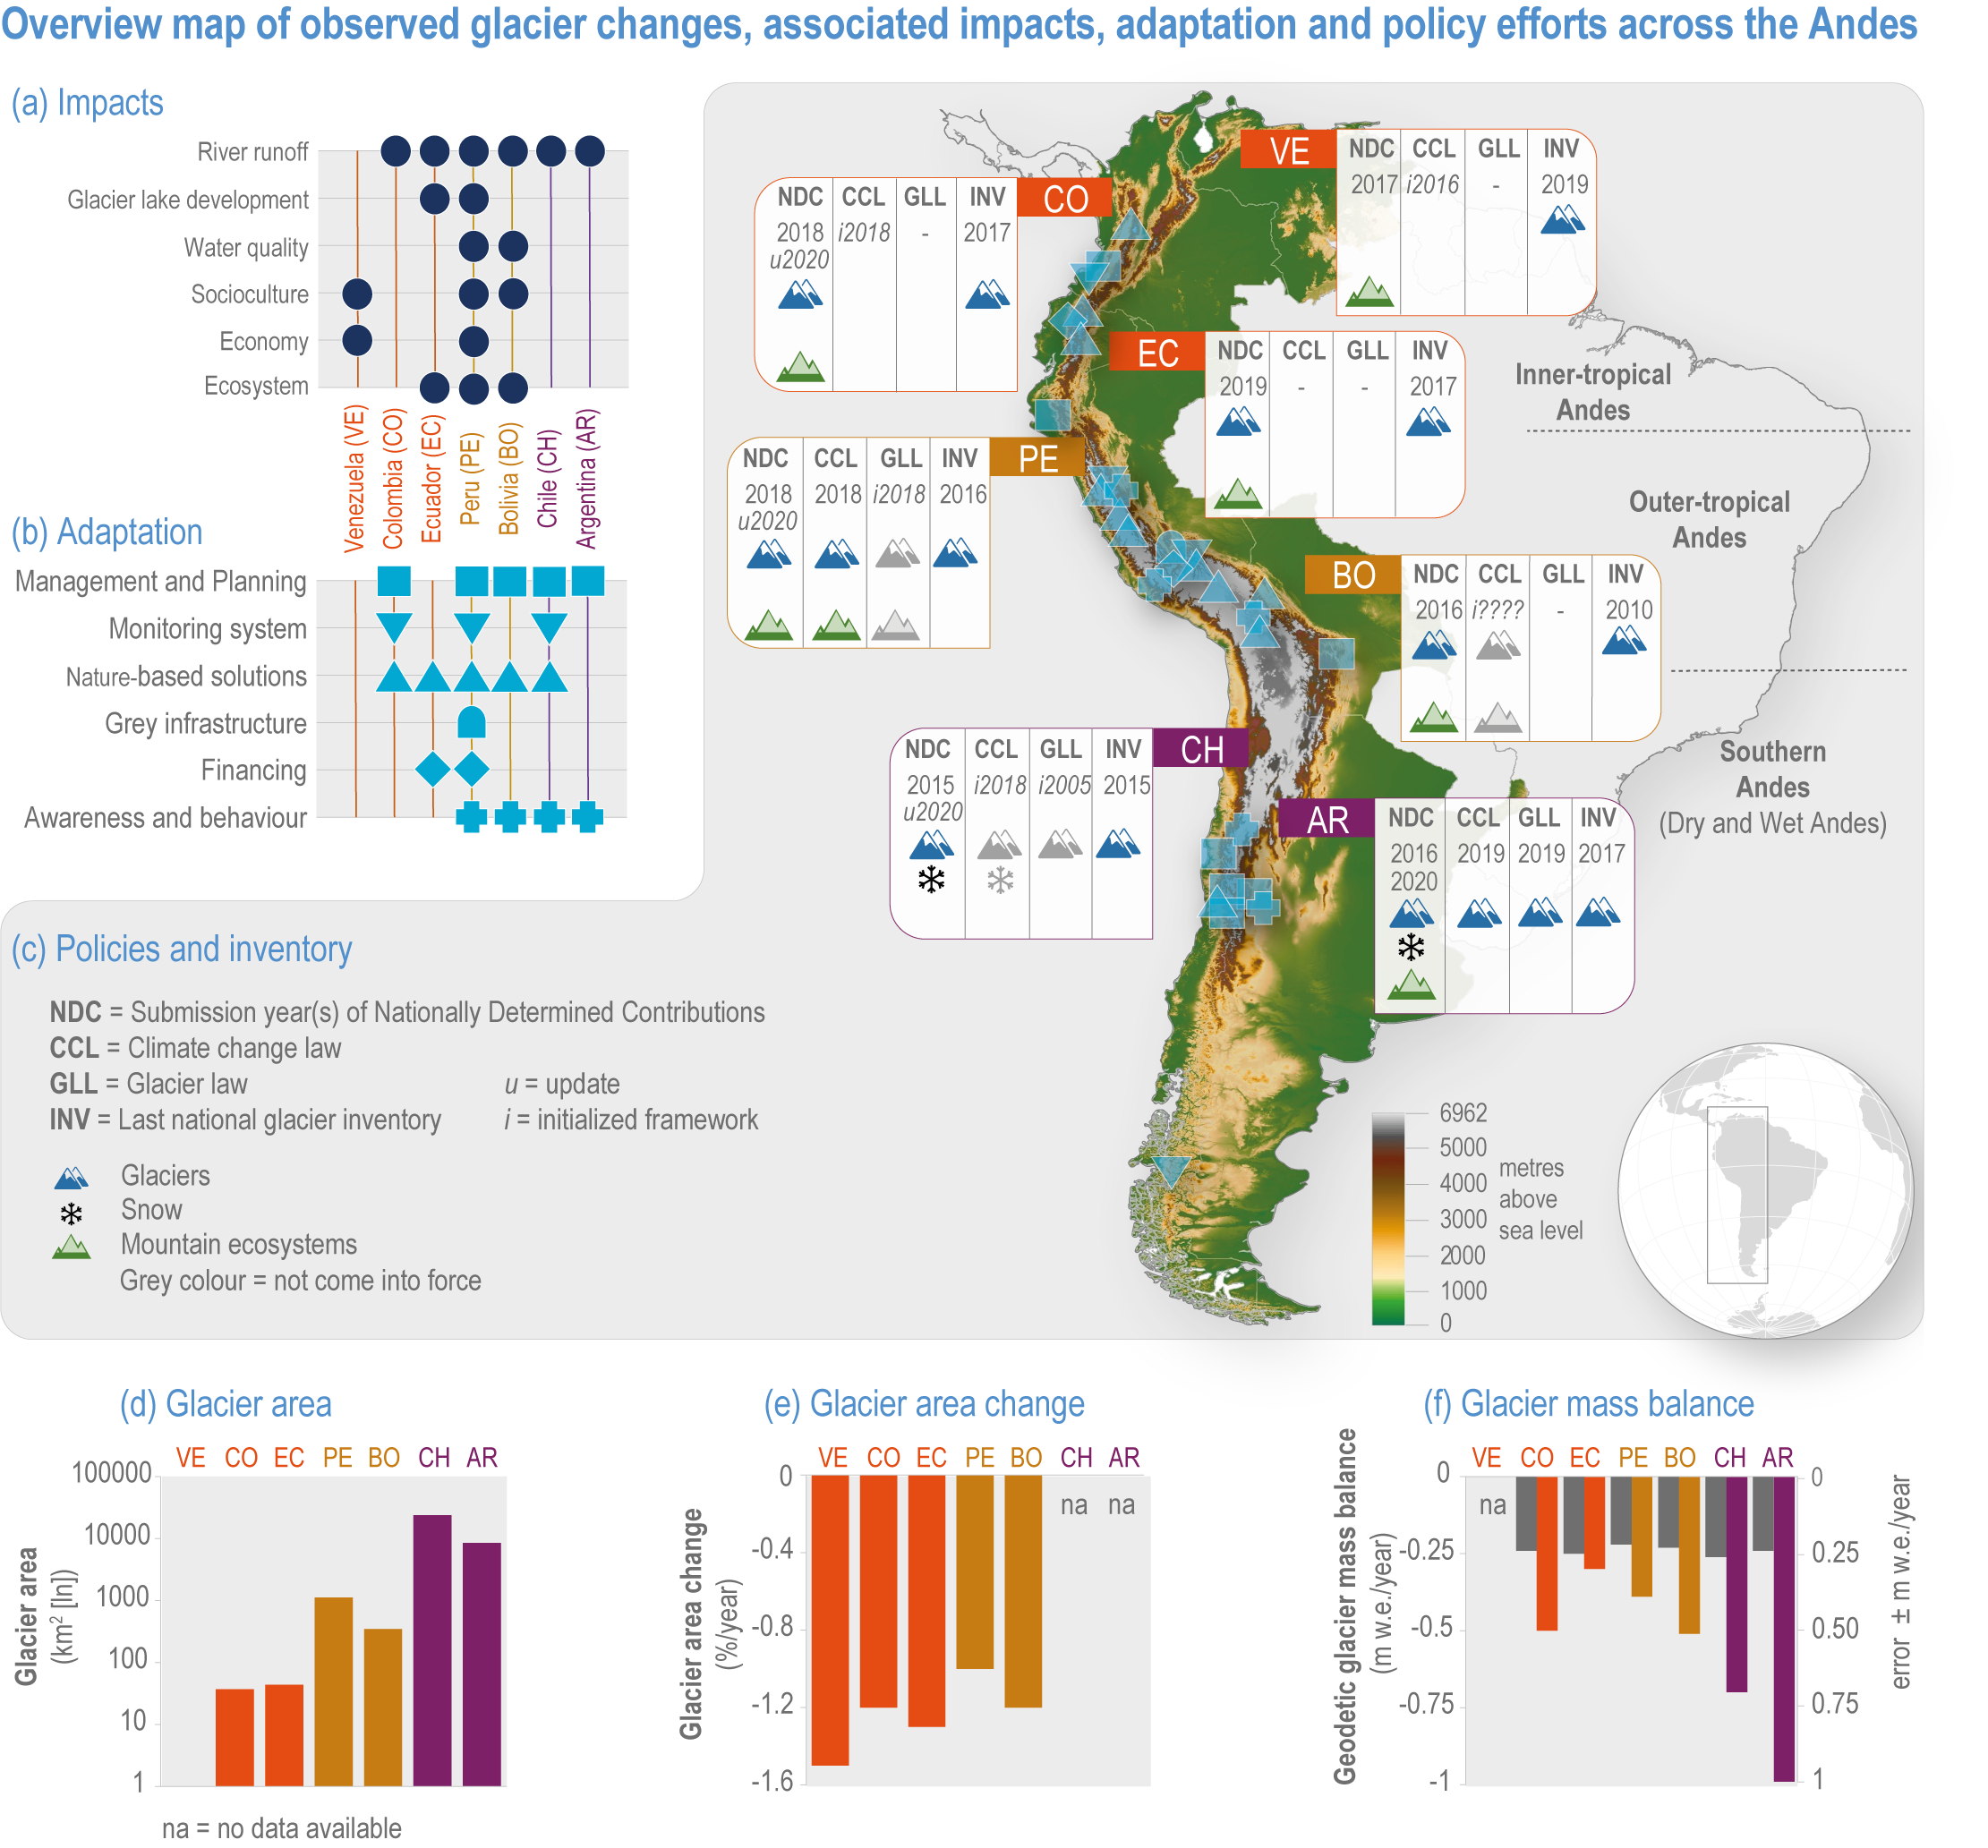
Figure caption
Figure 12.13 | Overview map of observed glacier changes, associated impacts, adaptation and policy efforts across the Andes.
(a) Selected impacts from glacier shrinkage.
(b) Selected adaptation efforts (see upper-right map for the location of each adaptation measure).
(c) Policies and glacier inventory: NDC = submission year(s) of Nationally Determined Contributions (u = update), CCL = climate change law, GLL = glacier law (i = initialised framework), INV = last national glacier inventory. The explicit mention of glaciers, snow and mountain ecosystems within each law/inventory is highlighted with the corresponding symbols (grey = has not come into force).
(d) Glacier area (km²) according to last national inventory.
(e) Glacier area change (%/year) according to baseline of last national inventory.
(f) Geodetic glacier mass balance in metres water equivalent per year (m w.e./year) and error estimate (±m w.e./year) retrieved from Dussaillant et al. (2019). nd = no data available. Further details can be found in the appendix in Table SM12.6.