Figure 13.15
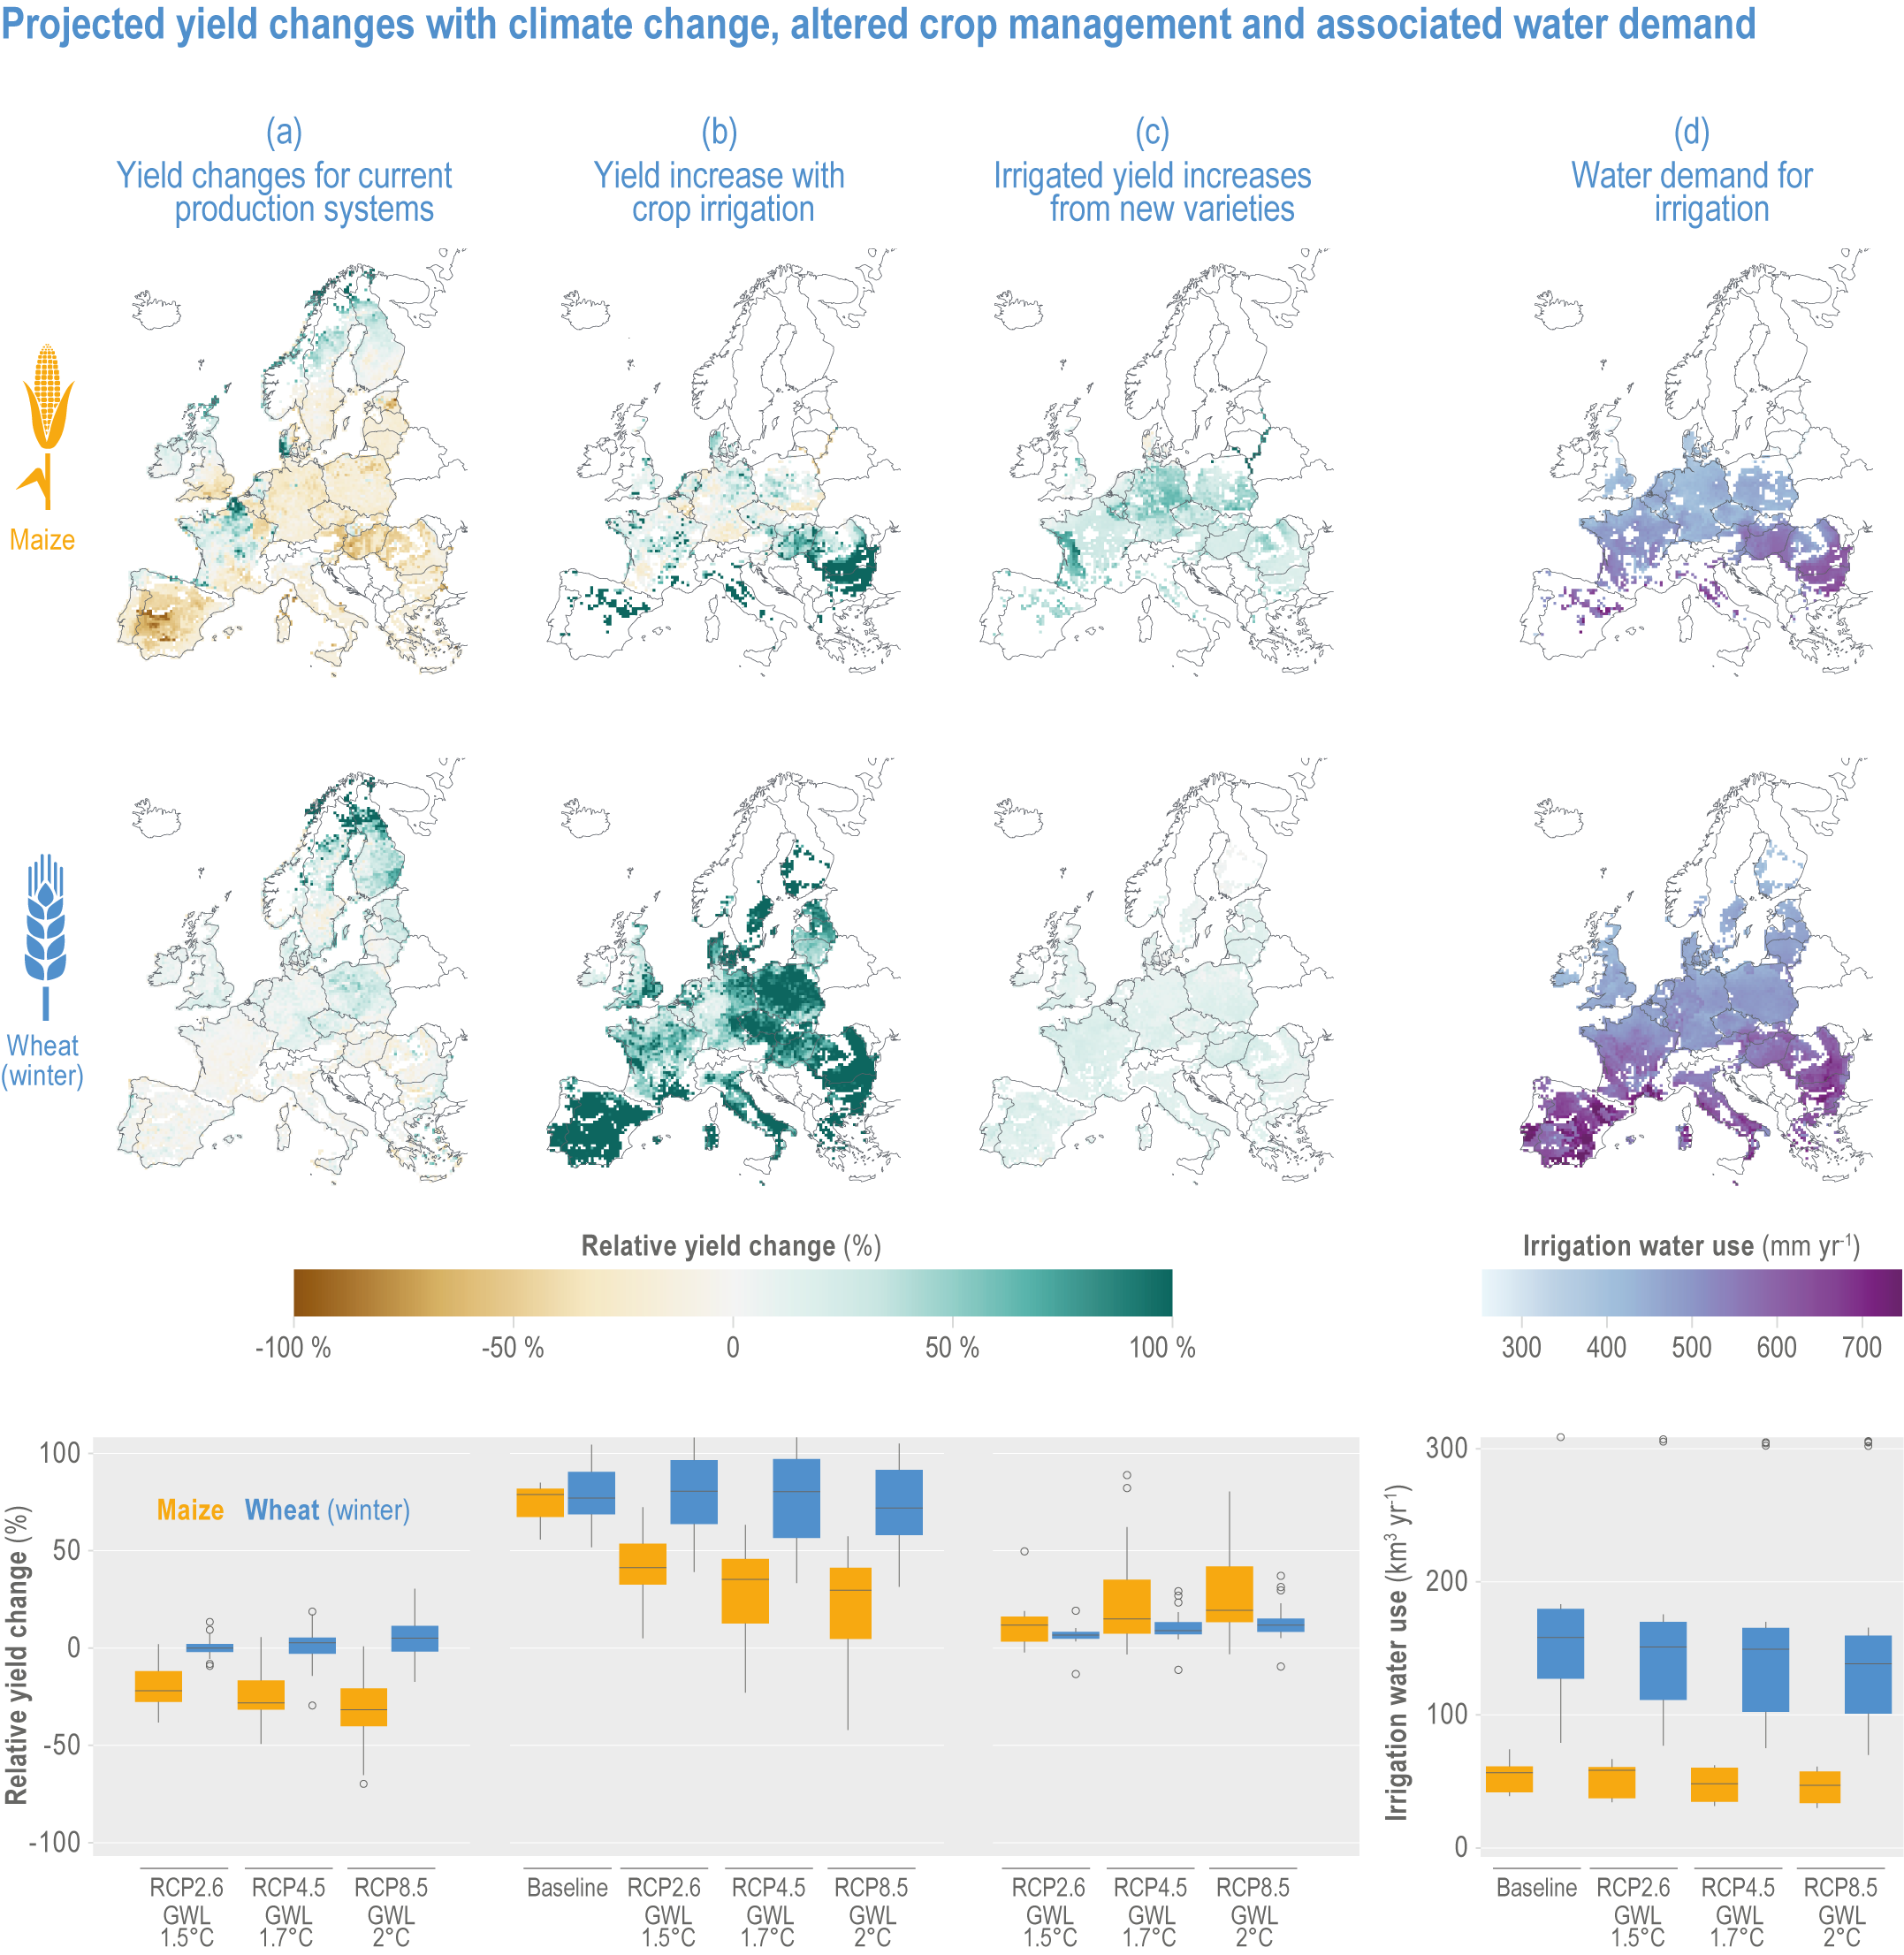
Figure caption
Figure 13.15 | Projected yield changes with climate change for 1. 5°C (RCP2.6), 1.7°C (RCP4.5) and 2°C GWL (RCP8.5). Altered crop management and associated water demand shows:
(a) relative yield changes under climate change and elevated CO2 for current production systems (i.e., rain-fed and irrigated simulations weighted by current the share of rain-fed and irrigated areas);
(b) yield increase if current predominantly rain-fed areas are fully irrigated;
(c) additional yield increases for irrigated production systems if new varieties are used to avoid losses associated with faster development and earlier maturity under climate change; and
(d) water demand for irrigated systems with current varieties in currently rain-fed areas (Webber et al., 2018). Relative yield changes to a period centred on 2055 relative to a baseline period centred on 1995. Box plots are Europe’s aggregate results considering current production areas (a) or current rain-fed areas (b,c), showing uncertainty across crop models and general circulation models. The maps are for the crop model median for RCP4.5 (1.7°C GWL) with GFDL-CM3.