Back chapter figures
Figure 13.30
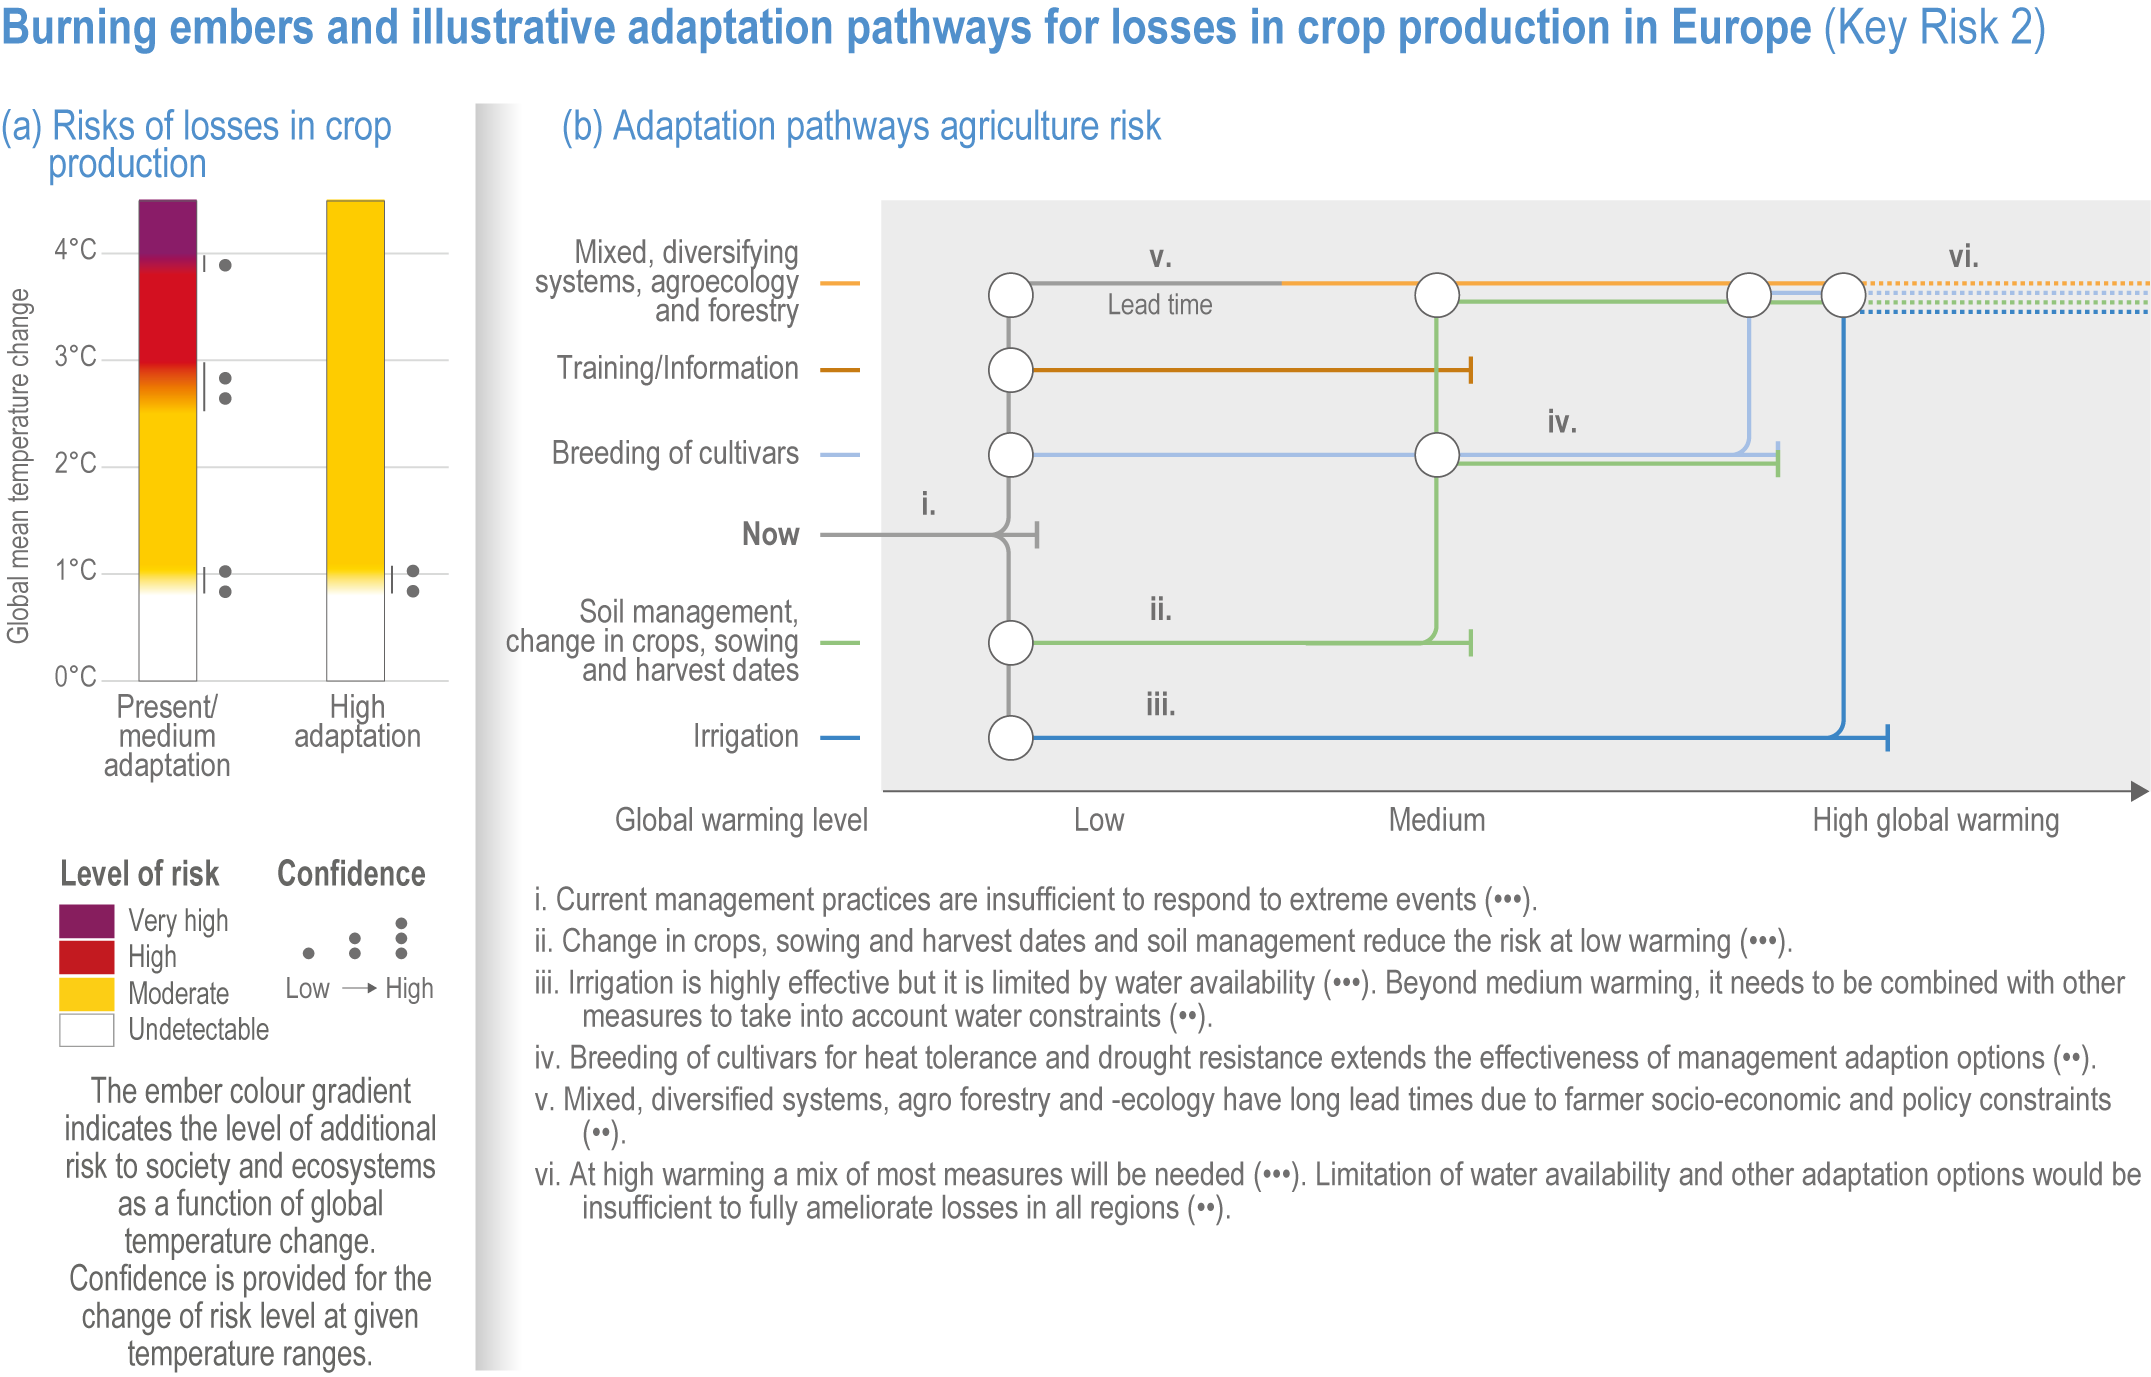
Figure caption
Figure 13.30 | Burning embers and illustrative adaptation pathways for losses in crop production (Key Risk 2)
(a) Burning ember diagrams for losses in crop production with present or medium adaptation conditions, and with high adaptation, are shown.
(b) Illustrative adaptation pathways and key messages based on the feasibility and effectiveness assessment in Figure 13.14. Grey shading means long lead time and dotted lines signal reduced effectiveness. The circles imply transfer to another measure and the bars imply that the measure has reached a tipping point (Table SM13.28).