Figure Box 14.4.1
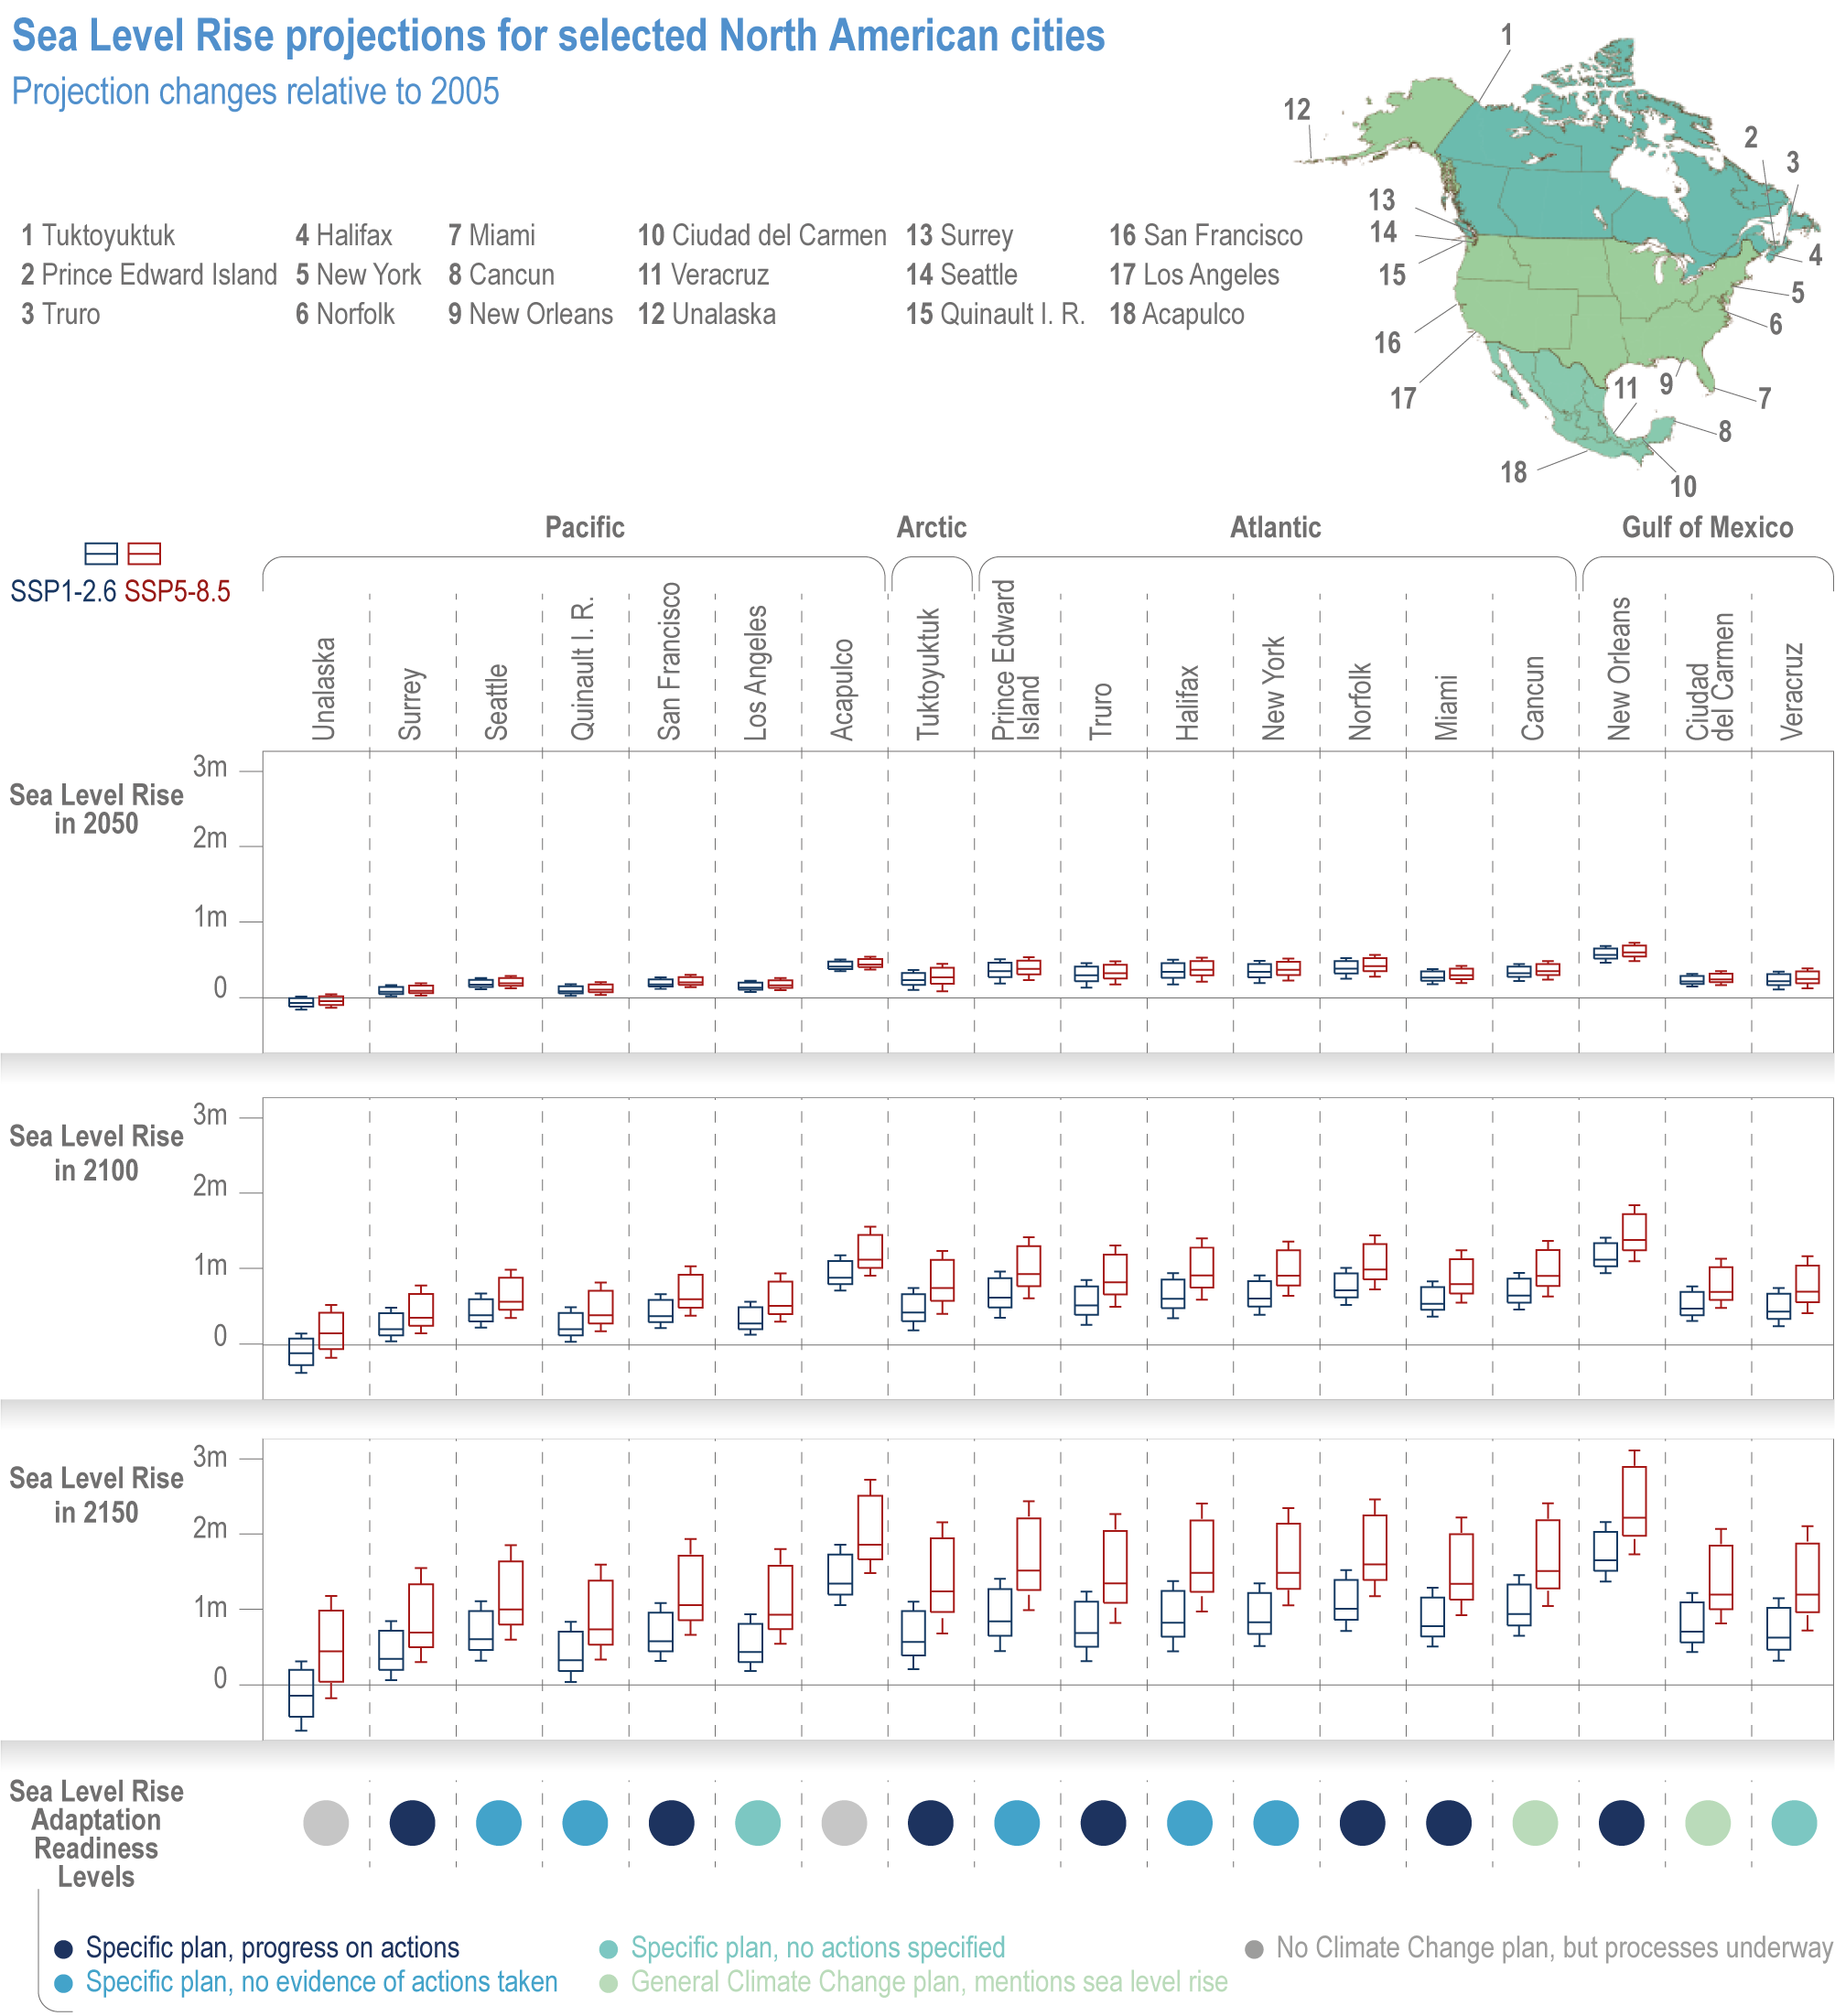
Figure caption
Figure Box 14.4.1 | Sea level rise projections for 2050, 2100 and 2150 for selected North American cities. Projections changes are relative to 2005, which is the central year for the 1994–2014 reference period. Horizontal lines in the boxes represent the median projection, boxes represent 25th to 75th percentile and whiskers the 10th to 90th percentile of SLR projections from all CMIP6 models as well as other lines of evidence (see Fox-Kemper et al., 2021 Table 9.7 for more details). Two SLR scenarios are provided for lower (SSP126) and higher emissions (SSP585), and are consistent with the WGI AR6 Interactive Atlas (Gutiérrez et al., 2021b. Numbers and colours (see Table Box 14.4.1 for detailed readiness definitions) on the map and in the projections represent the sites and status of SLR adaptation progress. Information supporting SLR adaptation status is summarised in Table Box 14.4.1.